Abstract
At Stage-III sensitivities, cosmic shear modes unambiguously indicate systematic contamination and are often used to inform data selection and scale cuts for cosmological inference. We validate modes for the Ultraviolet Near-Infrared Optical Northern Survey (UNIONS)-3500 using three /-separable statistics: pure-mode correlation functions , Complete Orthogonal Sets of /-mode Integrals (COSEBIs) , and harmonic-space power spectra . We perform null tests by computing probability-to-exceed (PTE) values for each statistic and comparing the minimum PTE to a threshold of 0.01, calibrated on systematics-free simulations. -mode detections on an initial catalog led us to repeat these tests for different sample selections and scale ranges before settling on fiducial cuts of 0.707 in galaxy-to-PSF size ratio, 12--83 arcmin in configuration space, and in harmonic space. At these cuts the fiducial catalog passes with a minimum PTE of 0.019; 11% of the systematics-free simulations have a lower PTE. When using the full range of angular scales between 1 and 250 arcmin, we measure an oscillatory COSEBI -mode pattern that could be explained by a repeating additive shear bias, a detector-level effect seen across multiple Stage-III surveys including CFHTLenS, which used the same MegaCam camera; scale cuts that exclude the charge-coupled device (CCD) angular scale suppress this pattern. Although the three -mode statistics probe the same two-point shear field, scale cuts applied in one basis do not map exactly onto cuts in another, because their filter functions weight angular scales differently. We therefore require scale and sample selections that pass null tests across all frameworks simultaneously, an approach that applies directly to Stage-IV surveys where systematic errors dominate.
Introduction
Weak gravitational lensing distorts the observed shapes of distant galaxies, encoding information about the intervening matter distribution along the line of sight Blandford et al., 1991Miralda-Escude, 1991Kaiser, 1992. First detections came in 2000 Bacon et al., 2000Kaiser et al., 2000Van Waerbeke et al., 2000Wittman et al., 2000. The scalar gravitational potential produces a shear field that is curl-free to leading order and can be decomposed into gradient-like modes and curl-like modes; under the Born approximation, scalar density perturbations source only -mode power Stebbins, 1996Kamionkowski et al., 1997. Higher-order effects (lens-lens coupling, source clustering, and intrinsic alignments) can produce modes Hilbert et al., 2009Schneider et al., 2002Crittenden et al., 2002, but these are orders of magnitude below current sensitivity Cooray & Hu, 2002. They are likely only accessible to future ultra-high-precision measurements, potentially through cross-correlation techniques involving CMB lensing rotation reconstructions and large-scale-structure tracers Robertson et al., 2025. For galaxy shear measurements at current sensitivity, detected -mode power indicates residual observational systematic effects rather than cosmological signal, though the absence of modes does not rule out systematic contamination.
Stage-III cosmic shear surveys have measured the structure growth parameter at percent-level precision, with some reporting up to tension with Planck Asgari et al., 2021Abbott et al., 2022Li et al., 2023Planck Collaboration, 2020. The Kilo-Degree Survey (KiDS)-Legacy Wright et al., 2025 found (0.73 from Planck) and the Dark Energy Survey (DES) Y6 DES Collaboration et al., 2026 found (); both achieved precision on , comparable to CMB constraints from Planck alone. Stage-IV surveys will reduce statistical uncertainties further, shifting the error budget toward systematic effects; current data offer the opportunity to validate these methods before that transition.
Several methods separate - and -mode contributions in shear two-point statistics. Aperture mass dispersion Schneider, 1996Schneider et al., 1998 is the foundational real-space method for / separation. In practice, however, its evaluation requires knowledge of the shear correlation functions down to zero separation, which is unavailable on a finite observed interval and leads to / mixing Schneider et al., 2010Schneider et al., 2022. Complete Orthogonal Sets of /-mode Integrals (COSEBIs; Schneider et al. (2010), Asgari et al. (2012)) generalize this approach, compressing all /-separable information from on a finite angular interval into discrete orthogonal modes. A small number of modes captures the cosmological signal; by construction, the COSEBI basis excludes the ambiguous modes that cannot be assigned pure or character on a finite interval. Pure-mode correlation functions Schneider et al., 2022 are an alternative real-space representation that decomposes into -mode, -mode, and ambiguous components through integral transforms derived from the COSEBI basis functions. Harmonic-space estimators measure and directly but require careful treatment of mask-induced / mixing; catalog-based methods that evaluate spherical harmonic transforms at source positions Wolz et al., 2025 avoid the pixelization artifacts that complicate standard implementations. The HybridEB Fourier band-power estimator Becker & Rozo, 2016 constructs -space band-powers from linear combinations of binned , projecting out ambiguous modes to minimize / mixing. DES Y6 adopted this estimator DES Collaboration et al., 2026, although COSEBIs are more widely used in the Stage-III literature, where they have traced systematic signatures across multiple surveys Asgari et al., 2019. These statistics represent -mode power in complementary bases, and the mapping between them is not one-to-one, so contamination excluded by scale cuts in one basis may remain visible in another. Comparing across bases can expose systematics that any single framework would absorb.
Stage-III analyses have found -mode contamination from a range of systematic effects. COSEBI analyses of the Canada-France-Hawaii Telescope Lensing Survey (CFHTLenS), KiDS-450, and DES-SV detected significant modes at 2--5 , linked to repeating additive shear bias, PSF leakage, and photometric selection effects Asgari et al., 2019. Repeating additive shear biases can arise from detector-level defects that imprint a constant ellipticity offset on each CCD, varying across the focal plane; because this pattern is fixed in instrument coordinates, it repeats with every pointing. The bias is constant within each CCD but jumps at chip boundaries; these discontinuities carry curl, generating -mode power at CCD angular scales. Hyper Suprime-Cam (HSC) Y3 used harmonic-space power spectra and found significant large-scale modes Li et al., 2023Dalal et al., 2023. A dedicated PSF-systematics study identified PSF fourth-moment leakage as a leading additive contaminant in the affected region Zhang et al., 2023. KiDS-Legacy tested with COSEBIs, traced an initial failure to astrometric systematics, and applied conservative masking with negligible impact on Wright et al., 2025. DES Y3 reported null detections using pseudo- and COSEBIs Gatti et al., 2021. However, Jefferson et al. (2025) applied the HybridEB estimator uniformly to DES-Y3 and HSC-Y3 data and found -mode failures in specific tomographic bins not seen with the estimators originally used. DES Y6 subsequently adopted the HybridEB estimator and passed DES Collaboration et al., 2026. Because each estimator weights angular scales differently and deprojects ambiguous modes differently, the same data can pass one null test and fail another. The most informative validation requires consistent passage across multiple statistics.
The Ultraviolet Near-Infrared Optical Northern Survey (UNIONS; Gwyn et al. (2025)) is surveying 6250 deg² of northern sky with multi-band imaging from telescopes in Hawai’i: the Canada-France Imaging Survey (CFIS) contributes - and -band imaging from CFHT, Pan-STARRS contributes - and -band data, and Subaru adds -band imaging through the Wide Imaging with Subaru HSC of the Euclid Sky (WISHES) and -band imaging through the Waterloo-Hawai’i Institute for Astronomy -band Survey (WHIGS). Nearly all Stage-III cosmic shear survey area is in the southern sky; UNIONS provides the first deep, wide-area shape catalog in the north, with -band median seeing of , enabling high-quality shape measurements. Guinot et al. (2022) presented the first UNIONS weak-lensing analysis over 1700 deg² using the ShapePipe pipeline Farrens et al., 2022; the present analysis expands this to 3500 deg² with an updated catalog (section).
We present -mode validation tests for the first UNIONS-3500 cosmic shear cosmology analysis, using pure-mode correlation functions , COSEBIs, and harmonic-space power spectra to define scale cuts in both angular and multipole space within a blinded analysis framework. This paper is one of five coordinated UNIONS-3500 weak-lensing publications: catalog construction (Paper I; Hervas-Peters et al. (2026)); the present -mode validation (Paper II); configuration-space cosmological constraints (Paper III; Goh et al. (2026)); harmonic-space cosmological constraints (Paper IV; Guerrini et al. (2026)); and image simulations (Paper V; Hervas-Peters et al., in prep.). We validate the fiducial scale cuts adopted for cosmological inference in Papers III and IV, both of which analyze the shear field without tomographic binning; a UNIONS tomographic analysis is now in progress. section describes the UNIONS shear catalogs, their evolution, and the simulations we use for validation. section details the three /-separable statistics and covariance framework. section presents the measurements and null-test results. section discusses systematic trends and methodological implications.
Data
UNIONS is the largest deep weak-lensing survey of the northern sky, with -band depth of at Gwyn et al., 2025. We analyze four variants of the ShapePipe v1.4 catalog, summarized in table; all survey-property statistics quoted in this article are derived from that table. The initial catalog uses a loose size cut (). For the size-cut catalog, we tighten this threshold to , removing galaxies where shape measurement and leakage correction are least reliable. For the masked catalog, we retain the tightened size cut and add bright-star () and faint-star () halo masking, reducing sky coverage by 13%. figure shows the holes this masking cuts into the footprint, typically across, comparable to the short side of a CCD. The relaxed-flags catalog uses the same sample selection as the size-cut catalog but relaxes the SExtractor flags criterion to include deblended objects, increasing the effective galaxy density by 26%. We introduced these refinements after blinded validation tests showed early signs of systematic contamination (Paper I). We adopt the size-cut catalog as the fiducial for Papers II, III, and IV.
For each catalog version, we produce shear measurements both with and without the object-wise PSF-leakage correction described in Paper I, which models PSF contamination via binned regression in signal-to-noise and galaxy-PSF size ratio; Guerrini et al. (2025) provide the broader PSF-leakage diagnostic framework used to assess its impact. We report results from the leakage-corrected catalogs, which are used for cosmological inference in Papers III and IV.
To validate our estimators and covariances, we use 350 lognormal simulated catalogs from the suite described in Paper III, generated with the GLASS package Tessore et al., 2023. Each realization samples galaxy positions from a full-sky lognormal density field, within the survey footprint and following the fiducial redshift distribution. The galaxies carry unit weights and Gaussian intrinsic ellipticities matching the data’s . The realizations thus contain sample variance (including from modes larger than the footprint), lognormal non-Gaussianity, and shape noise, but no PSF leakage or other imaging systematics. Because of an error in the catalog generation, their galaxy number density is 17% higher than that of the data, which we account for when comparing covariances (section). The companion cosmology papers validate their pipelines and covariances on the same suite (Paper III for CosmoCov, Paper IV for NaMaster).
Survey properties for UNIONS shear catalog versions.
| Catalog | Area (deg²) | (arcmin⁻²) | |
|---|---|---|---|
| Initial | 2894 | 6.48 | 0.28 |
| Size cuts (fiducial) | 2894 | 4.96 | 0.27 |
| Masked | 2517 | 4.98 | 0.27 |
| Relaxed flags | 2894 | 6.26 | 0.27 |
follows Heymans et al. (2012) and is the per-component ellipticity dispersion, both from metacalibration-weighted samples. All versions share the same footprint except the masked catalog.
Figure 1. Fiducial (top) and masked (bottom) footprints in a region, with the positions of the 40 MegaCam CCDs in one exposure outlined in red. The footprints are determined directly from the galaxy positions, for both the configuration-space and the catalog-based harmonic-space estimators. The smaller gaps are predominantly bright-star masks, while the larger holes in the bottom panel are stellar-halo masks.
The footprint image has no baseline lc output and is omitted.
Methods
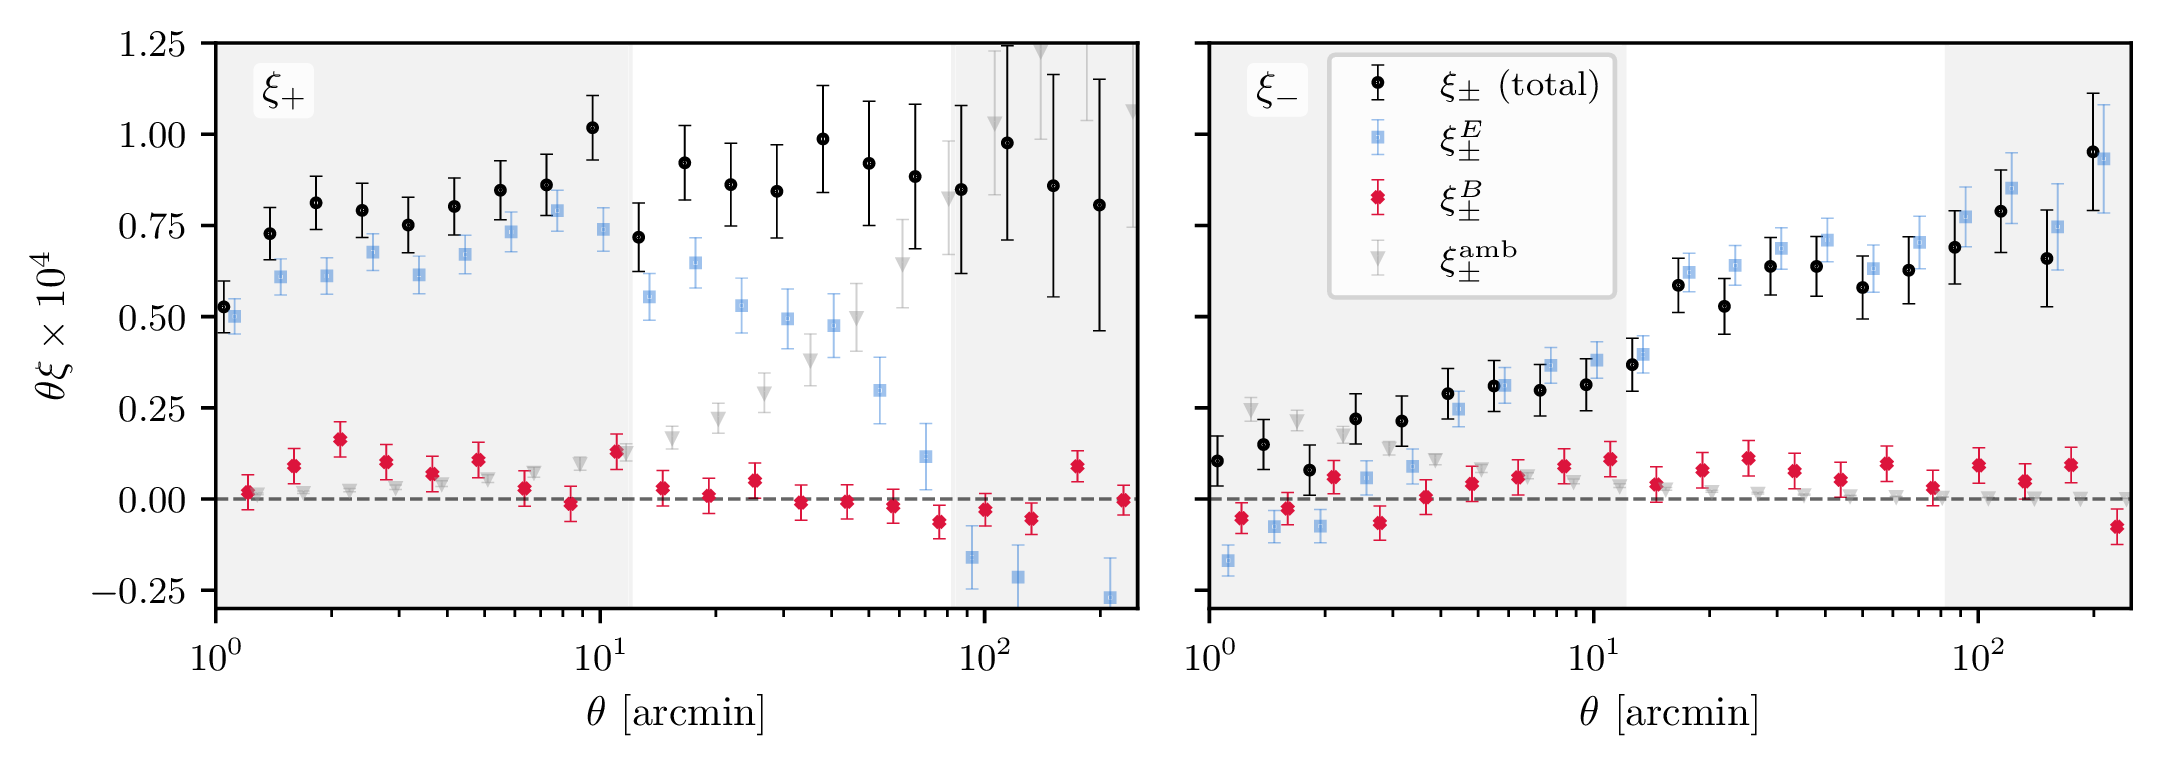
Figure 1:Pure E/B-mode decomposition of the measured shear correlation functions for the fiducial catalog. Panels show ξ_+ (left) and ξ_- (right) decomposed into total (black circles), E-mode (teal squares), B-mode (crimson ×), and ambiguous (purple triangles) components following Schneider et al. (2022). The E modes trace the lensing signal, while B modes—which should vanish for pure gravitational lensing—diagnose systematic contamination. Ambiguous modes capture boundary effects from the finite angular range. Shaded regions indicate fiducial scale cuts.
Provenance
- Fiducial ShapePipe v1.4 catalog variantSize-cut (SP_v1.4.6.3_leak_corr, fiducial)
- How the fiducial θ cut is defined relative to the reporting binsBin edges of the reporting grid (indices 9, 16)
- Fiducial blind for reported data vectorsBlind A (fiducial for reported data vectors)
- Quadrature used by the pure E/B integral transformFixed-quadrature linear operator M
- Weights of the fine-to-reporting average of the pure modesPair-count weighted mean (Asgari et al. 2019 Appendix A) (adopted)
- [θ_min, θ_max] of the pure-mode integral transform[grid floor, 300'] — 0.5' data / 0.5' mocks, capped at 300'
- Construction of the pure-mode covarianceExact linear propagation M C_ξ Mᵀ, no Hartlap (adopted)
shapepipe_v14_catalogsshapepipe_v145_rerunfootprint_masksredshift_distributionscosmocov_binarycosmocov_libgslpaper_mplstylePure /-mode decomposition of the measured shear correlation functions for the fiducial catalog. Panels show (left) and (right) decomposed into total (black circles), -mode (teal squares), -mode (crimson ), and ambiguous (purple triangles) components following Schneider et al. (2022). The modes trace the lensing signal, while modes---which should vanish for pure gravitational lensing---diagnose systematic contamination. Ambiguous modes capture boundary effects from the finite angular range. Shaded regions indicate fiducial scale cuts.
Two-point correlation measurements
All -mode diagnostics in this analysis use the discrete shear catalog , comprising complex ellipticities , shear weights (Paper I), and sky positions for source galaxies. The ellipticities are shear estimates calibrated via metacalibration Huff & Mandelbaum, 2017Sheldon & Huff, 2017: galaxy images are artificially sheared to measure the shear response matrix , yielding from the observed ellipticity and additive bias . The two-point shear correlation functions are formed from products of tangential and cross-component ellipticities for galaxy pairs at separation . We estimate by weighting each pair by metacalibration weights and accumulating contributions in angular bins:
Here and are the tangential and cross components of the ellipticity in the coordinate frame defined by the pair-separation vector, is the binning kernel selecting pairs with separations in bin , and . We evaluate equation using the tree-based correlation package TreeCorr Jarvis et al., 2004. We bin into 20 logarithmic bins over --250 arcmin, matching the configuration-space data-vector binning adopted in Paper III.
In harmonic space, the analogous statistics are the angular power spectra and . We estimate these using the MASTER algorithm Hivon et al., 2002, which recovers the true by deconvolving the mode-coupling matrix induced by the survey geometry, as implemented in NaMaster Alonso et al., 2019. Traditional implementations operate on pixelized maps, but Wolz et al. (2025) introduced a catalog-based estimator that evaluates spherical harmonic transforms directly at source positions, avoiding pixelization artifacts. The same weighted ellipticities from equation enter this estimator:
where label the two ellipticity components, are spin-2 spherical harmonics, and . We then decouple the measured bandpowers and correct for noise bias following Wolz et al. (2025), yielding unbiased harmonic-space bandpower estimates .
Pure / decomposition
We decompose the measured correlation functions into pure -mode, -mode, and ambiguous components following Schneider et al. (2022):
Ambiguous modes arise from shear patterns that cannot be assigned unique - or -mode origin on a finite angular interval; they take the functional forms and . They therefore appear on large scales in and on small scales in , as seen in figure. The pure-mode correlation functions are computed from integral transforms over the measured :
Here, the sign gives -modes and the sign gives -modes. The auxiliary functions and enforce boundary conditions that remove ambiguous modes: and Schneider et al., 2022.
The integral transforms require finely binned over an extended angular range. We evaluate these transforms on a separate 1000-bin logarithmic grid spanning --300 arcmin, and the limits and in equation and equation are this full extent; the extended range reduces edge effects in the boundary functions and . We apply the Schneider et al. (2022) filter kernels to this grid as a fixed linear operator, using the cosmo_numba[1] implementation Guinot & Mandelbaum, 2026 and integrating each grid cell with a Gauss--Legendre rule. We then average the resulting pure modes over each of the 20 reporting bins, weighting by pair counts. figure shows the pure / decomposition for the fiducial catalog.
COSEBIs
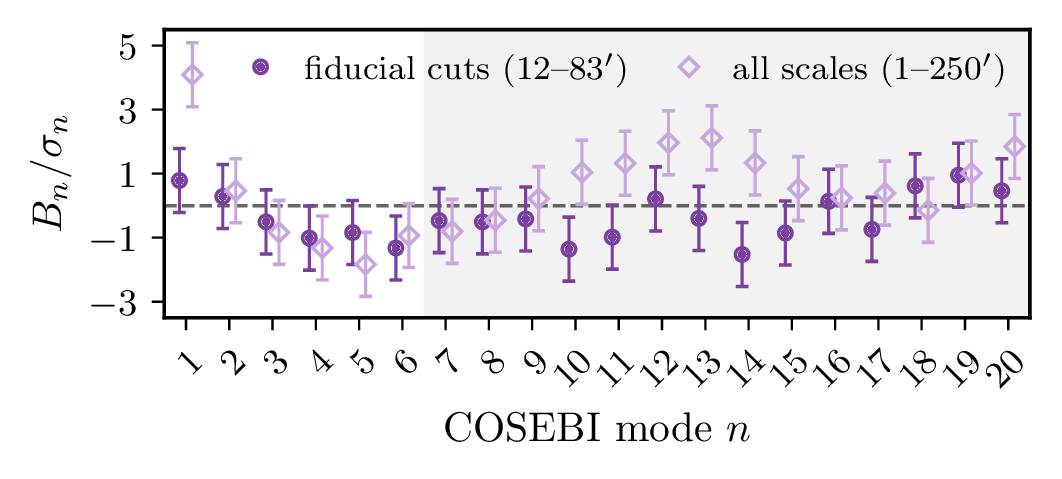
Figure 2:COSEBI B-mode amplitudes for the fiducial catalog, normalized by uncertainty (B_n/σ_n), at the fiducial scale cuts of 12–83 arcmin (filled circles) and over the full angular range of 1–250 arcmin (open diamonds). Modes n > 6 are shaded; the n ≤ 6 subset captures nearly all cosmological information.
Provenance
- Fiducial ShapePipe v1.4 catalog variantSize-cut (SP_v1.4.6.3_leak_corr, fiducial)
- Fiducial blind for reported data vectorsBlind A (fiducial for reported data vectors)
- PTE-reported mode subsetsvia cosebisBoth subsets (fiducial)
- How the fiducial θ cut is defined relative to the reporting binsBin edges of the reporting grid (indices 9, 16)
- Number of COSEBI modes computedvia cosebis20 modes (fiducial)
shapepipe_v14_catalogsshapepipe_v145_rerunfootprint_masksredshift_distributionscosmocov_binarycosmocov_libgslpaper_mplstyleprint_width_scriptCOSEBI -mode amplitudes for the fiducial catalog, normalized by uncertainty (), at the fiducial scale cuts of 12--83 arcmin (filled circles) and over the full angular range of 1--250 arcmin (open diamonds). Modes are shaded; the subset captures nearly all cosmological information.
COSEBIs compress into discrete orthogonal modes and , with clean / separation on finite angular intervals Schneider et al., 2010. The filter functions are constructed to satisfy boundary conditions that remove the ambiguous modes described in section. Because the are orthonormal, different modes capture largely independent information. Each oscillates times across the angular interval; higher- modes are therefore sensitive to increasingly oscillatory features in -space. Conversely, a feature localized in angle projects onto many modes at once, producing an oscillatory signature across the basis.
We compute the COSEBI mode amplitudes over a given angular range arcmin using logarithmic filter functions:
where the upper (lower) sign gives (). We evaluate these integrals on the same 1000-bin grid used for the pure-mode transforms (section). As a convergence check, we repeat the calculation on a 10 000-bin grid for the fiducial catalog and find the amplitudes and their significance to be stable.
figure shows COSEBI -mode amplitudes for the first modes of the fiducial catalog. For the UNIONS data vector, the -mode signal saturates by --6 (see section), so we take as the set of modes carrying most of the cosmological information, while also testing the modes for all .
Pure-mode correlation functions (section) can be reconstructed from the COSEBI coefficients:
where and . In practice, we compute the pure-mode correlation functions directly from the finely binned measurements rather than reconstructing them from the COSEBI coefficients. COSEBIs require consistent angular ranges for and , while the pure-mode integral transforms equation and equation permit independent scale cuts for each.
The COSEBI modes can equivalently be computed from harmonic-space power spectra:
where are the harmonic-space COSEBI filter functions (Fourier duals of , computed via FFT-log) and the sum runs over bandpower bins. Each oscillates times, mirroring its real-space counterpart. A fine binning of the bandpowers is needed to resolve these oscillations, so for this transform we use 96 square-root-spaced bins, distinct from the 32 bandpowers of the direct null tests (section). The number of bins balances two requirements: too few cannot resolve the filter oscillations at high , while too many lead to an unstable mode-coupling matrix deconvolution. We validated the transform on the GLASS simulations, confirming that modes ---the range carrying nearly all cosmological -mode information---agree between the two paths.
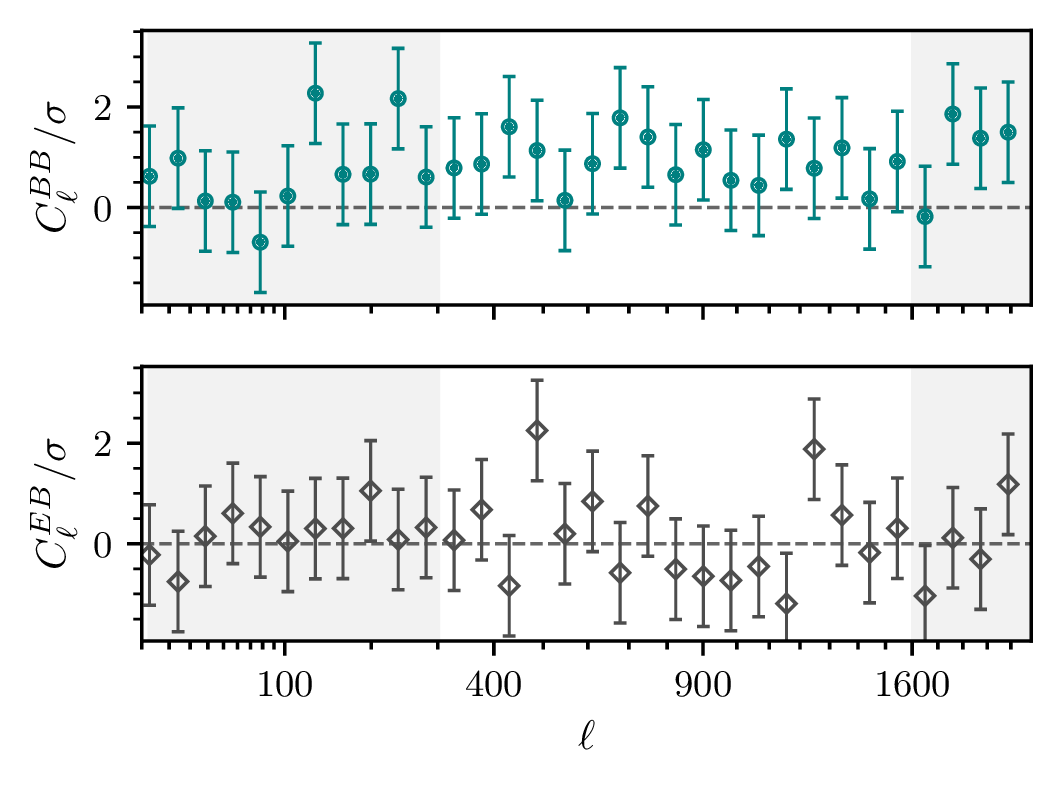
Figure 3:Harmonic-space power spectra for the fiducial catalog, normalized by uncertainty. Top: B-mode auto-power C_ℓ^BB/σ. Bottom: E-B cross-power C_ℓ^EB/σ. C_ℓ^BB is predominantly positive across the fiducial range. C_ℓ^EB scatters symmetrically around zero, suggesting that any B-mode contamination is not strongly correlated with the lensing signal.
Provenance
- Fiducial ShapePipe v1.4 catalog variantSize-cut (SP_v1.4.6.3_leak_corr, fiducial)
- Fiducial blind for reported data vectorsBlind A (fiducial for reported data vectors)
shapepipe_v14_catalogsshapepipe_v145_rerunredshift_distributionsfootprint_maskspseudo_cl_cov_scriptpaper_mplstyleprint_width_scriptHarmonic-space power spectra for the fiducial catalog, normalized by uncertainty. Top: -mode auto-power . Bottom: - cross-power . is predominantly positive across the fiducial range. scatters symmetrically around zero, suggesting that any -mode contamination is not strongly correlated with the lensing signal.
Catalog-based harmonic-space power spectra
We estimate and equation directly from the discrete catalog, providing -dependent -mode diagnostics that complement the angular-space statistics. The Wolz et al. (2025) estimator represents the survey mask as delta functions at source positions and computes the spin-2 transforms on this irregular grid using the ducc library Reinecke & Seljebotn, 2023. We subtract an analytic shot-noise contribution following the implementation in Paper IV. We bin into 32 bandpowers with square-root spacing () over . figure shows the measured and for the fiducial catalog.
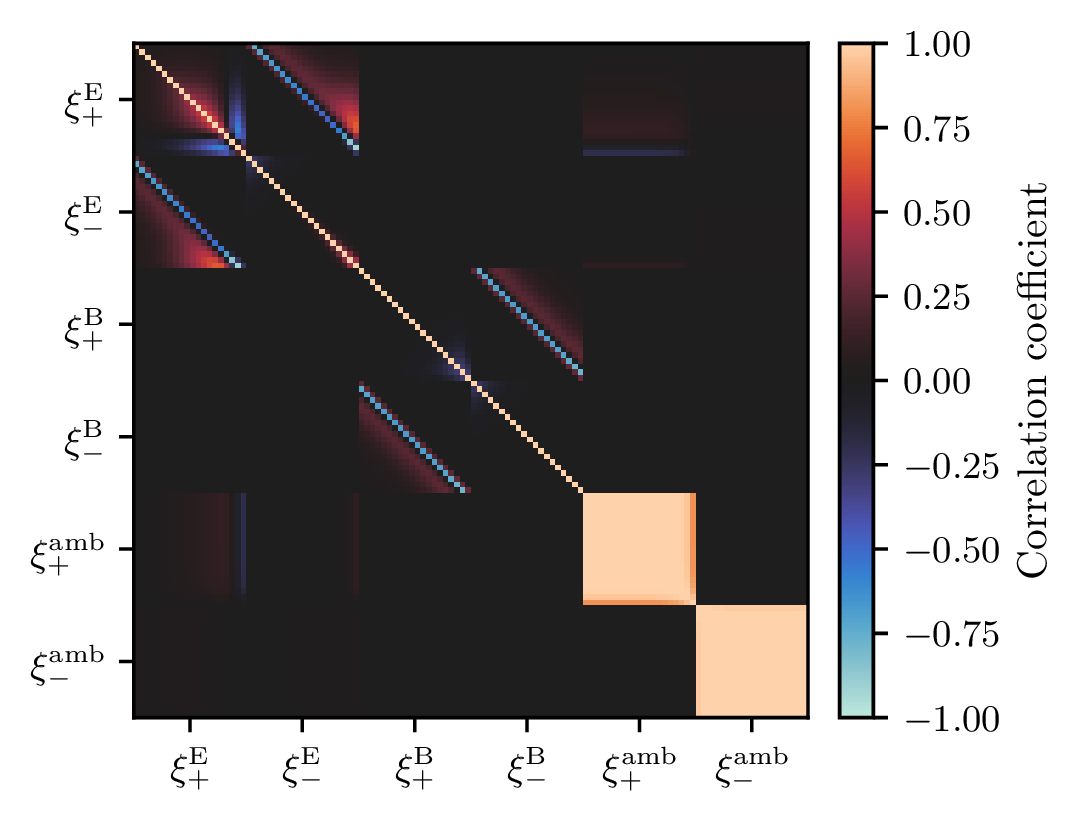
Figure 4:Pure E/B-mode correlation-function covariance matrix for the fiducial catalog, propagated linearly from the CosmoCov ξ_± covariance. The matrix is organized into six blocks: ξ_+^E, ξ_-^E, ξ_+^B, ξ_-^B, ξ_+^amb, ξ_-^amb, with 20 angular bins per block. Off-diagonal correlations arise from integral coupling in the pure-mode filters.
Provenance
- Fiducial ShapePipe v1.4 catalog variantSize-cut (SP_v1.4.6.3_leak_corr, fiducial)
- Fiducial blind for reported data vectorsBlind A (fiducial for reported data vectors)
- Quadrature used by the pure E/B integral transformFixed-quadrature linear operator M
- Weights of the fine-to-reporting average of the pure modesPair-count weighted mean (Asgari et al. 2019 Appendix A) (adopted)
- [θ_min, θ_max] of the pure-mode integral transform[grid floor, 300'] — 0.5' data / 0.5' mocks, capped at 300'
- Construction of the pure-mode covarianceExact linear propagation M C_ξ Mᵀ, no Hartlap (adopted)
shapepipe_v14_catalogsshapepipe_v145_rerunfootprint_masksredshift_distributionscosmocov_binarycosmocov_libgslpaper_mplstylePure /-mode correlation-function covariance matrix for the fiducial catalog, propagated linearly from the CosmoCov covariance (section). The matrix is organized into six blocks: , , , , , , with 20 angular bins per block. Off-diagonal correlations arise from integral coupling in the pure-mode filters.
Covariance estimation
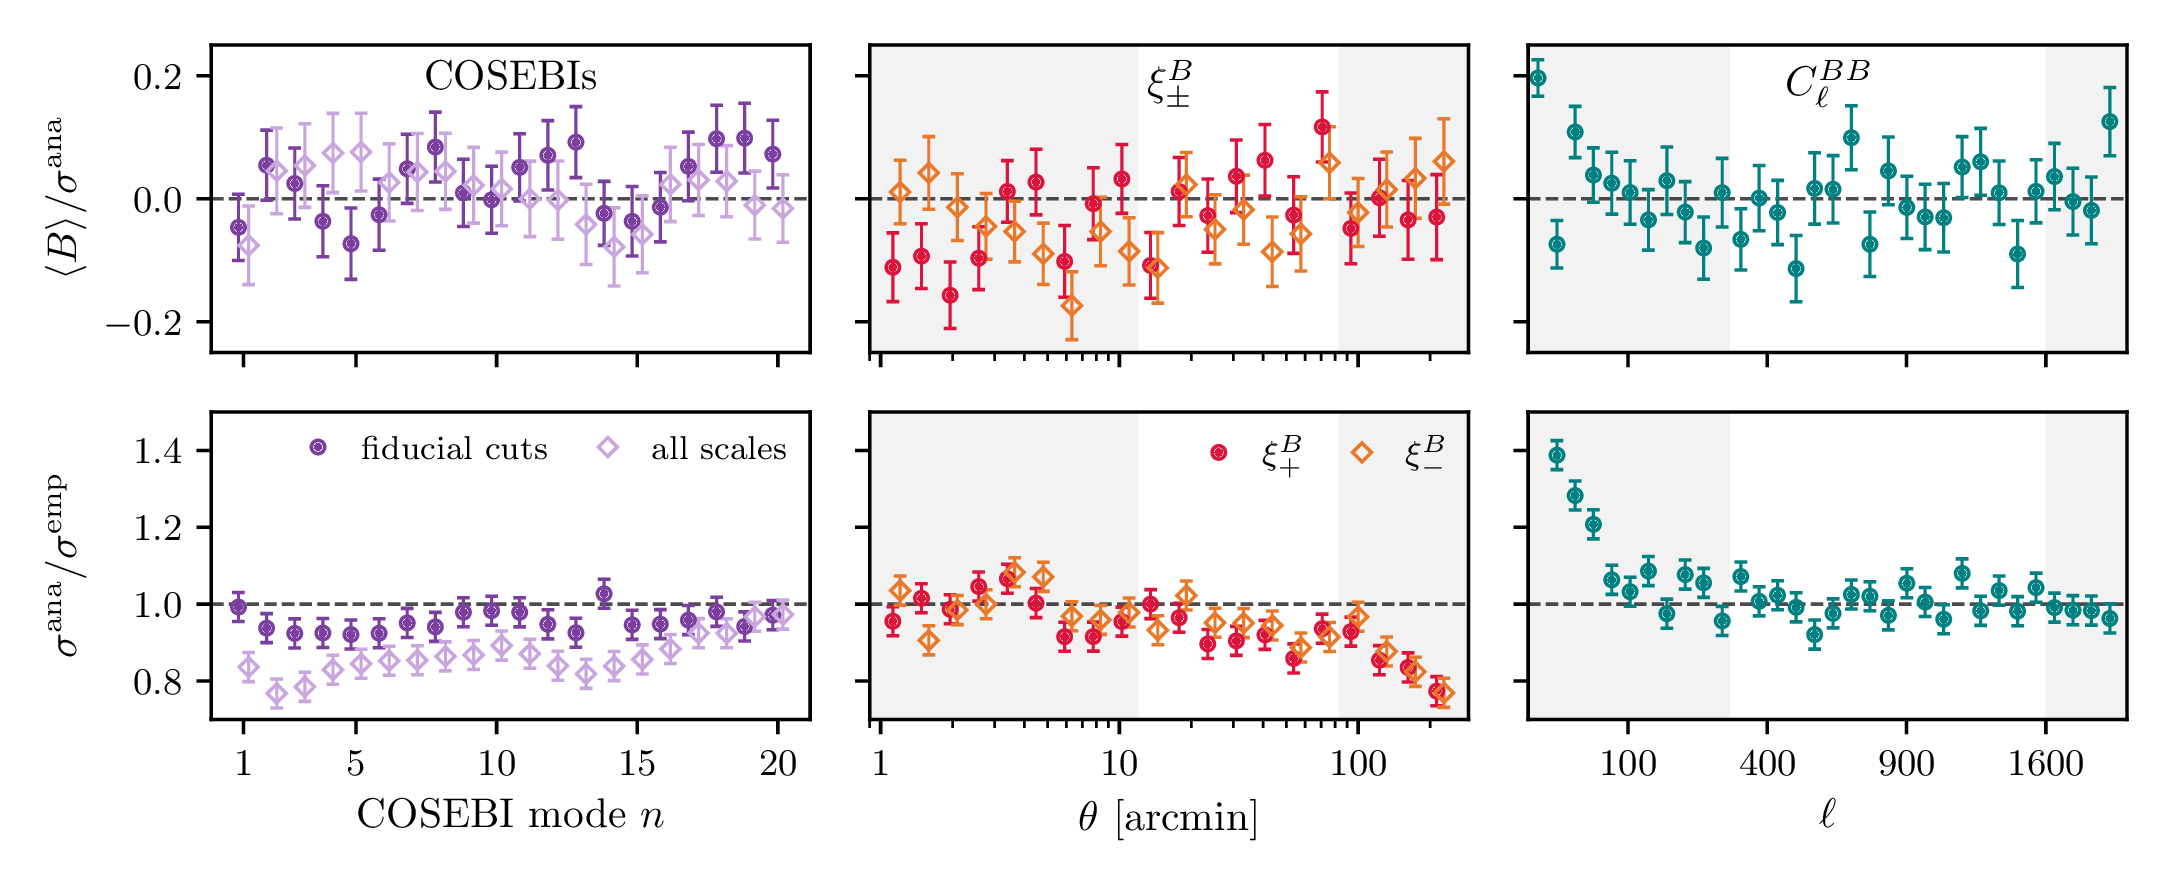
Figure 5:The mock-validation figure: two rows over the three
B statistics on every reporting bin — COSEBI modes 1–20 on
the full 1–250′ range, ξ±^B on all reporting bins, C_ℓ^BB on
all 32 bands — with the scales outside the fiducial cuts
shaded. Row 1 is the across-realisation mean in units of the
analytic (data) σ, with σ_emp/(σ_ana√N) error bars, so it
reads as “fraction of a data error bar”. Row 2 is
σ_ana/σ_emp, the check that the analytic covariance
reproduces the mock scatter — below one means the analytic
uncertainties are tighter than the mock scatter — with ±1/√(2N) error bars — the
sampling uncertainty of a ratio of standard deviations
estimated from N realisations. The lowest C_ℓ band is
dropped from the ratio panel alone — its ≈1.8 would set the
whole row’s range — and kept in the mean panel. Colour
encodes the mode, not the statistic: every series is the
crimson
pure
Provenance
- Analytic covariance the mock scatter is compared againstvia glass_mocksThe fiducial covariance machinery rerun at the mocks' own noise
- GLASS realisation suitevia glass_mocksv1.4.6.3_v2 suite (2026-03, fiducial catalog)
- How the fiducial θ cut is defined relative to the reporting binsBin edges of the reporting grid (indices 9, 16)
- Fiducial ShapePipe v1.4 catalog variantSize-cut (SP_v1.4.6.3_leak_corr, fiducial)
- Fiducial blind for reported data vectorsBlind A (fiducial for reported data vectors)
- Quadrature used by the pure E/B integral transformFixed-quadrature linear operator M
- Weights of the fine-to-reporting average of the pure modesPair-count weighted mean (Asgari et al. 2019 Appendix A) (adopted)
- [θ_min, θ_max] of the pure-mode integral transform[grid floor, 300'] — 0.5' data / 0.5' mocks, capped at 300'
- Construction of the pure-mode covarianceExact linear propagation M C_ξ Mᵀ, no Hartlap (adopted)
- Monte-Carlo samples for covariance propagation2000 (fiducial)
glass_mock_catalogsglass_mock_xi_reportingglass_mock_clshapepipe_v14_catalogsshapepipe_v145_rerunfootprint_masksredshift_distributionscosmocov_binarycosmocov_libgslpseudo_cl_cov_scriptcov_integration_mockmatchedcl_cov_mockmatchedmock_validation_figure_scriptplotting_utils_scriptpaper_mplstyleValidation of the -mode estimators and covariances on 350 GLASS mock realizations. Top: mean -mode data vector across realizations, in units of the analytic . Bottom: ratio of the analytic used in the PTE calculations to the scatter across realizations. Left: COSEBIs at the fiducial cuts (filled) and over all scales (open); center: (filled) and (open); right: . Shaded regions mark scales outside the fiducial cuts.
For each -mode statistic, we start from the same covariance prescriptions adopted in the companion cosmology papers. In configuration space, Paper III uses CosmoCov Krause & Eifler, 2017Fang et al., 2020 to model the covariance of the shear correlation functions ; we compute this covariance on a 1000-bin logarithmic grid spanning --300 arcmin, using the survey properties of Paper I and the Planck 2018 fiducial cosmology Planck Collaboration, 2020. For COSEBIs and the pure-mode correlation functions, we compute the covariance as the linear transformation , where encodes the COSEBI filter functions or the pure-mode transforms of section; we show the pure-mode covariance in figure. In harmonic space, we use the Gaussian covariance from NaMaster’s iNKA framework for and , as Paper IV does for its -mode null tests, adding non-Gaussian terms only for the cosmology analysis.
For all -mode null tests, we retain only the Gaussian part of the covariance. In configuration space, this keeps the calculation tractable on the finely binned integration grid. This approximation underestimates the true variances because it omits connected trispectrum and super-sample covariance terms, which can also add off-diagonal structure. In Paper IV we find that adding these terms, computed with OneCovariance Reischke et al., 2025, increases the diagonal errors by about 5% at . In configuration space, the non-Gaussian terms contribute about 9% of the diagonal variance of within the fiducial scale cuts. The null tests are therefore conservative: a test that passes with the Gaussian-only covariance would generally pass with a more complete covariance estimate, as the simulations of section confirm.
Two independent checks support these covariances. Paper IV validates the harmonic-space -mode covariance against Gaussian simulations (Appendix C therein), and its -mode covariance against the OneCovariance code Reischke et al., 2025 and the GLASS mocks of section. During development we also compared the semi-analytic covariance against a jackknife estimate from the data and found ten-percent-level agreement over the fiducial angular range.
Validation on simulations
| version | version_full | cut | cosebis_n6 | cosebis_n20 | xip_B | xim_B | xitot_B | cl_BB |
|---|---|---|---|---|---|---|---|---|
| Initial | SP_v1.4.5_leak_corr | Fiducial | 0.938 | 0.611 | 0.526 | 0.00119 | 0.00138 | 0.00311 |
| Initial | SP_v1.4.5_leak_corr | Full_range | 7.37e-10 | 4.15e-07 | 8.71e-07 | 1.77e-06 | 2.45e-05 | 2.52e-04 |
| Size_cuts | SP_v1.4.6.3_leak_corr | Fiducial | 0.777 | 0.943 | 0.823 | 0.0193 | 0.0387 | 0.299 |
| Size_cuts | SP_v1.4.6.3_leak_corr | Full_range | 1.37e-05 | 1.08e-04 | 0.00257 | 0.00194 | 0.0101 | 0.136 |
| Masked | SP_v1.4.8_leak_corr | Fiducial | 0.604 | 0.811 | 0.864 | 0.00359 | 0.0401 | 0.441 |
| Masked | SP_v1.4.8_leak_corr | Full_range | 4.94e-06 | 2.50e-05 | 1.88e-04 | 7.51e-05 | 5.47e-04 | 0.131 |
| Relaxed_flags | SP_v1.4.11.3_leak_corr | Fiducial | 0.824 | 0.831 | 0.418 | 7.48e-05 | 6.68e-05 | 5.85e-10 |
| Relaxed_flags | SP_v1.4.11.3_leak_corr | Full_range | 1.70e-10 | 1.16e-08 | 5.74e-08 | 1.25e-08 | 1.25e-06 | 1.78e-12 |
Table 1:B-mode PTE values across catalog versions at fiducial and full-range scale cuts. Fiducial scale cuts are 12–83 arcmin in configuration space and 300 < ℓ < 1600 in harmonic space; the full range is 1–250 arcmin / 8 ≤ ℓ ≤ 2048. A row passes the null test when its minimum PTE is at least p_thr = 0.01; only the fiducial catalog at the adopted cuts passes.
Provenance
- How the fiducial θ cut is defined relative to the reporting binsBin edges of the reporting grid (indices 9, 16)
- Fiducial ShapePipe v1.4 catalog variantSize-cut (SP_v1.4.6.3_leak_corr, fiducial)
- Fiducial blind for reported data vectorsBlind A (fiducial for reported data vectors)
- Quadrature used by the pure E/B integral transformFixed-quadrature linear operator M
- Weights of the fine-to-reporting average of the pure modesPair-count weighted mean (Asgari et al. 2019 Appendix A) (adopted)
- [θ_min, θ_max] of the pure-mode integral transform[grid floor, 300'] — 0.5' data / 0.5' mocks, capped at 300'
- Construction of the pure-mode covarianceExact linear propagation M C_ξ Mᵀ, no Hartlap (adopted)
- Gaussian vs Gaussian + non-Gaussian covariancevia covarianceGaussian only (fiducial for null tests)
- Scale-cut pair grid for COSEBI PTE matricesvia cosebisStable index pairs of geomspace(1', 250', 21) (fiducial)
- PTE-reported mode subsetsvia cosebisBoth subsets (fiducial)
shapepipe_v14_catalogsshapepipe_v145_rerunfootprint_masksfootprint_mask_starhaloredshift_distributionscosmocov_binarycosmocov_libgslredshift_distributions_legacyconfig_space_pte_matrices_scriptscale_cuts_scriptpseudo_cl_cov_scriptgenerate_paper_macros_script-mode PTE values across catalog versions at fiducial and full-range scale cuts.
Fiducial scale cuts are 12--83 arcmin in configuration space and in harmonic space; the full range is 1--250 arcmin / . A row passes the null test when its minimum PTE is at least 0.01; only the fiducial catalog at the adopted cuts passes.
No systematics are injected into the GLASS realizations (section), so they allow us to test directly whether our estimators generate spurious modes from a noise-dominated signal. For these comparisons we recompute the analytic covariances of section at the galaxy density of the realizations. Across the ensemble, the pure-mode decomposition, COSEBIs, and harmonic-space power spectra all recover modes consistent with zero (top row of figure); the mean COSEBI deviates from zero by at most 0.1 in any mode.
We also use the simulations to test the covariances, comparing the analytic of each statistic with the scatter across realizations (bottom row of figure). At the fiducial cuts, the median ratio of analytic to mock over bins is 0.92--0.95 in configuration space and 1.01 in harmonic space. The agreement degrades on the large scales outside the fiducial cuts. There the analytic is about 17% too small for the first COSEBI mode and for above , while for below it is too large because -to- leakage is treated only approximately Nicola et al., 2021. PSF leakage already excludes these scales (Paper I), so the miscalibration does not affect our choice of scale cuts.
-mode significance
We assess -mode significance across a grid of angular scale-cut combinations. For each scale range, we test the -mode data vector against zero with , where is the -mode covariance submatrix for the selected scale range (section). The probability-to-exceed, , is the probability that a variable with degrees of freedom exceeds the measured value; we set equal to the number of data points in the range. For the pure-mode decomposition, a scale cut selects reporting bins of the full-range decomposition, and we compute PTEs separately for and , as well as a joint test using the concatenated data vector and full cross-covariance. For COSEBIs, which we recompute for each angular range, we evaluate PTEs using both and (section). For , we apply the same framework across multipole ranges. We compute a PTE for each of the six statistics at each scale range and take the smallest as our test statistic. Although each PTE is expected to be uniformly distributed in the absence of -modes, their minimum is skewed toward low values because the six statistics are not perfectly correlated. We therefore set the passing threshold on the systematics-free mock realizations of section such that a clean sample fails 5% of the time, as would be the case for a single test at PTE . We adopt a representative single value, 0.01, which is conservative for nearly all scale-cut combinations; at the fiducial cuts the calibrated value is 0.006 (figure). We do not apply a look-elsewhere correction for the many scale-cut combinations tested, because the modes were only one of four factors that informed the scale cuts, alongside PSF leakage, modeling systematics, and the scale-cut dependence of the blinded cosmological constraints (Papers III and IV).[2]
We use the same realizations to test the sampling distribution assumed for the PTE. The PTEs are uniform, while the configuration-space PTEs skew mildly low, with 1.07--1.2. This excess matches the covariance comparison above. In configuration space the analytic is slightly smaller than the mock scatter, which raises by the inverse square of their ratio; in harmonic space the two agree. Calibrating on the same realizations partially absorbs this skew.
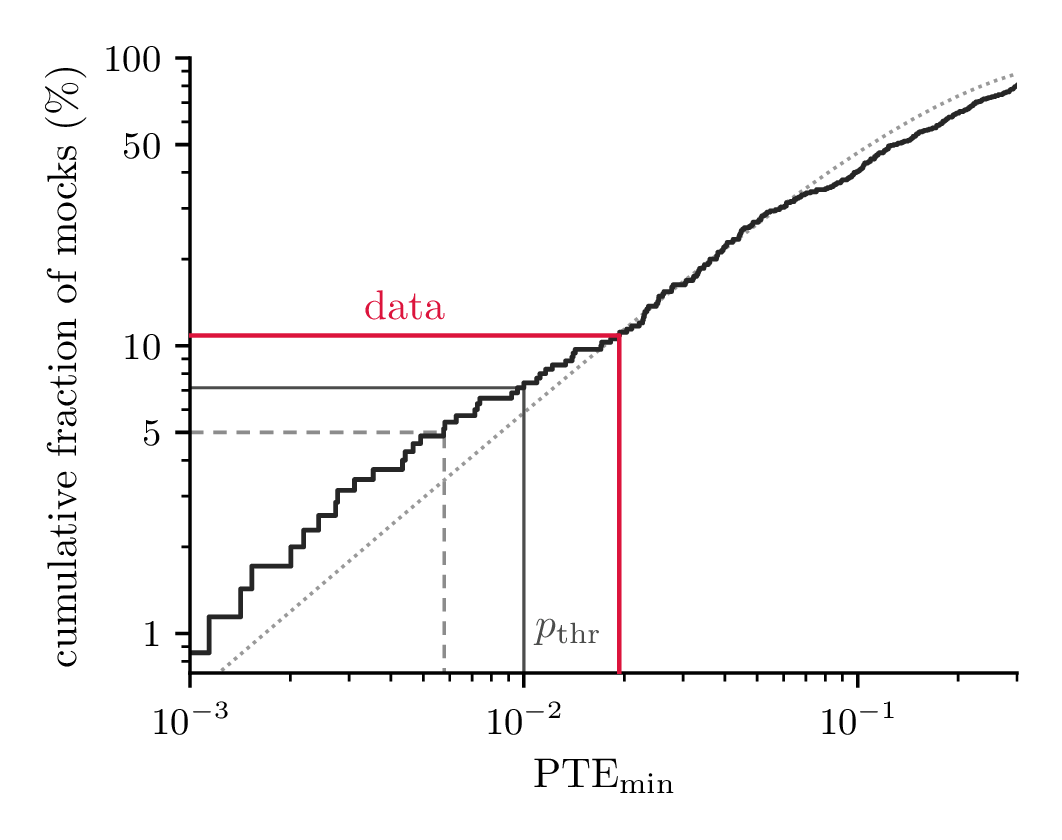
Figure 6:Cumulative distribution of the minimum PTE over the six statistics at the fiducial cuts, across the 350 GLASS realizations. Gray dashed lines mark the 5% quantile, which calibrates the adopted threshold p_thr = 0.01 (solid gray lines; global PTE threshold), chosen to be conservative across nearly all scale cuts. Red lines mark the minimum PTE of the data, which 11% of realizations fall at or below. The dotted curve shows the expectation for six independent tests. The mocks generally follow this expectation because of two effects that largely cancel: correlations between the statistics raise the minimum PTE, while the slightly underestimated configuration-space covariance lowers it.
Provenance
- Analytic covariance the mock scatter is compared againstvia glass_mocksThe fiducial covariance machinery rerun at the mocks' own noise
- GLASS realisation suitevia glass_mocksv1.4.6.3_v2 suite (2026-03, fiducial catalog)
- How the fiducial θ cut is defined relative to the reporting binsBin edges of the reporting grid (indices 9, 16)
- Global PTE pass/fail threshold for colour-coded heatmaps0.01 (adopted representative value; 350-mock calibration)
- Fiducial ShapePipe v1.4 catalog variantSize-cut (SP_v1.4.6.3_leak_corr, fiducial)
- Fiducial blind for reported data vectorsBlind A (fiducial for reported data vectors)
- Quadrature used by the pure E/B integral transformFixed-quadrature linear operator M
- Weights of the fine-to-reporting average of the pure modesPair-count weighted mean (Asgari et al. 2019 Appendix A) (adopted)
- [θ_min, θ_max] of the pure-mode integral transform[grid floor, 300'] — 0.5' data / 0.5' mocks, capped at 300'
- Construction of the pure-mode covarianceExact linear propagation M C_ξ Mᵀ, no Hartlap (adopted)
- Monte-Carlo samples for covariance propagation2000 (fiducial)
- Scale-cut pair grid for COSEBI PTE matricesvia cosebisStable index pairs of geomspace(1', 250', 21) (fiducial)
- PTE-reported mode subsetsvia cosebisBoth subsets (fiducial)
glass_mock_catalogsglass_mock_xi_reportingglass_mock_clshapepipe_v14_catalogsshapepipe_v145_rerunfootprint_masksredshift_distributionscosmocov_binarycosmocov_libgslpseudo_cl_cov_scriptcov_integration_mockmatchedcl_cov_mockmatchedredshift_distributions_legacymock_min_pte_calibration_scriptplotting_utils_scriptscale_cuts_scriptpaper_mplstyleCumulative distribution of the minimum PTE over the six statistics at the fiducial cuts, across the 350 GLASS realizations. Gray dashed lines mark the 5% quantile, which calibrates the adopted threshold 0.01 (solid gray lines), chosen to be conservative across nearly all scale cuts. Red lines mark the minimum PTE of the data, which 11% of realizations fall at or below. The dotted curve shows the expectation for six independent tests. The mocks generally follow this expectation because of two effects that largely cancel: correlations between the statistics raise the minimum PTE, while the slightly underestimated configuration-space covariance (section) lowers it.
These tests were carried out within the blinded analysis framework shared with Papers III and IV. Blinding was performed on the source redshift distribution. An external coordinator generated three variants, two with random shifts, and all analysis choices were made before the true variant was revealed (Paper III). The does not enter the -mode data vectors, and its effect on their covariances is negligible. We computed the covariances for each of the three variants. In configuration space they are identical, since the Gaussian -mode covariance of a null signal is shape noise alone; in harmonic space they agree to better than 0.5% over the fiducial multipole range, the residual coming from -to- leakage from the mask. We therefore use a single variant throughout.
Results
For the fiducial catalog before scale cuts, COSEBIs fail with a first mode and both pure-mode correlation functions fail, while passes but shows low-level -mode structure (table). At the adopted scale cuts, the fiducial catalog passes with a minimum PTE of 0.019; 11% of the systematics-free realizations have a lower (figure). We chose those cuts using the -mode tests together with additional systematics checks and blinded inference-stability checks in Papers III and IV. The object-wise PSF-leakage correction (Paper I) shifts individual PTEs by at most 0.093 across all catalog versions and statistics; no pass/fail conclusion changes. We report leakage-corrected results throughout.
The low-level features that drive the full-range behavior leave different signatures in each statistic. In the pure-mode decomposition (figure), shows a broad positive excess on the smallest angular scales that tapers toward zero by arcmin, apart from a outlier in the 9--12 arcmin bin, just below the fiducial lower cut. This outlier appears in all four catalog versions (figure) and coincides with a jump in the total , at roughly the angular size of a MegaCam CCD. The corresponding is quieter on the smallest scales but remains broadly elevated from roughly 7 arcmin to the largest scales. The COSEBI data vector (figure) compresses the same structure into a smaller number of modes: on the full angular range, the first mode reaches and the higher modes show coherent oscillations, whose possible origins we discuss in section; after applying the fiducial angular cuts, the first-mode excess drops below 1 and the oscillatory pattern largely disappears. In harmonic space (figure), shows a low-level positive offset across much of the fiducial range, with the most conspicuous outliers near and 250, and above . Even so, the fiducial range passes the null test, while remains consistent with zero, suggesting that any -mode contamination is not strongly correlated with the lensing signal.
figure compares the -mode measurements across catalog versions, and table summarizes the PTEs. At the fiducial cuts, and COSEBIs pass for all four versions, whereas shows a broad positive excess from roughly 7 arcmin to the largest scales in every version, driving failures in all but the fiducial catalog. The fiducial catalog passes, but at the edge of its acceptance region (figure). In harmonic space (figure), the initial and relaxed-flags catalogs fail across most multipole combinations, whereas the fiducial and masked catalogs show broad acceptance regions. Only the fiducial catalog passes all statistics at the adopted cuts.
At full range, all versions show low-order oscillatory structure consistent with the repeating additive pattern discussed below, driving COSEBI () PTEs to 1.37 × 10⁻⁵ or below; at fiducial cuts, all versions pass, although the initial catalog retains a mild oscillatory pattern.
figure and figure map null-test performance over the full grid of scale-cut combinations. In the configuration-space maps, and COSEBI failures concentrate at small , below the fiducial cut. For COSEBIs, whose data vector is indexed by mode number rather than angle, the PTE heatmap translates null-test performance back into angular space.
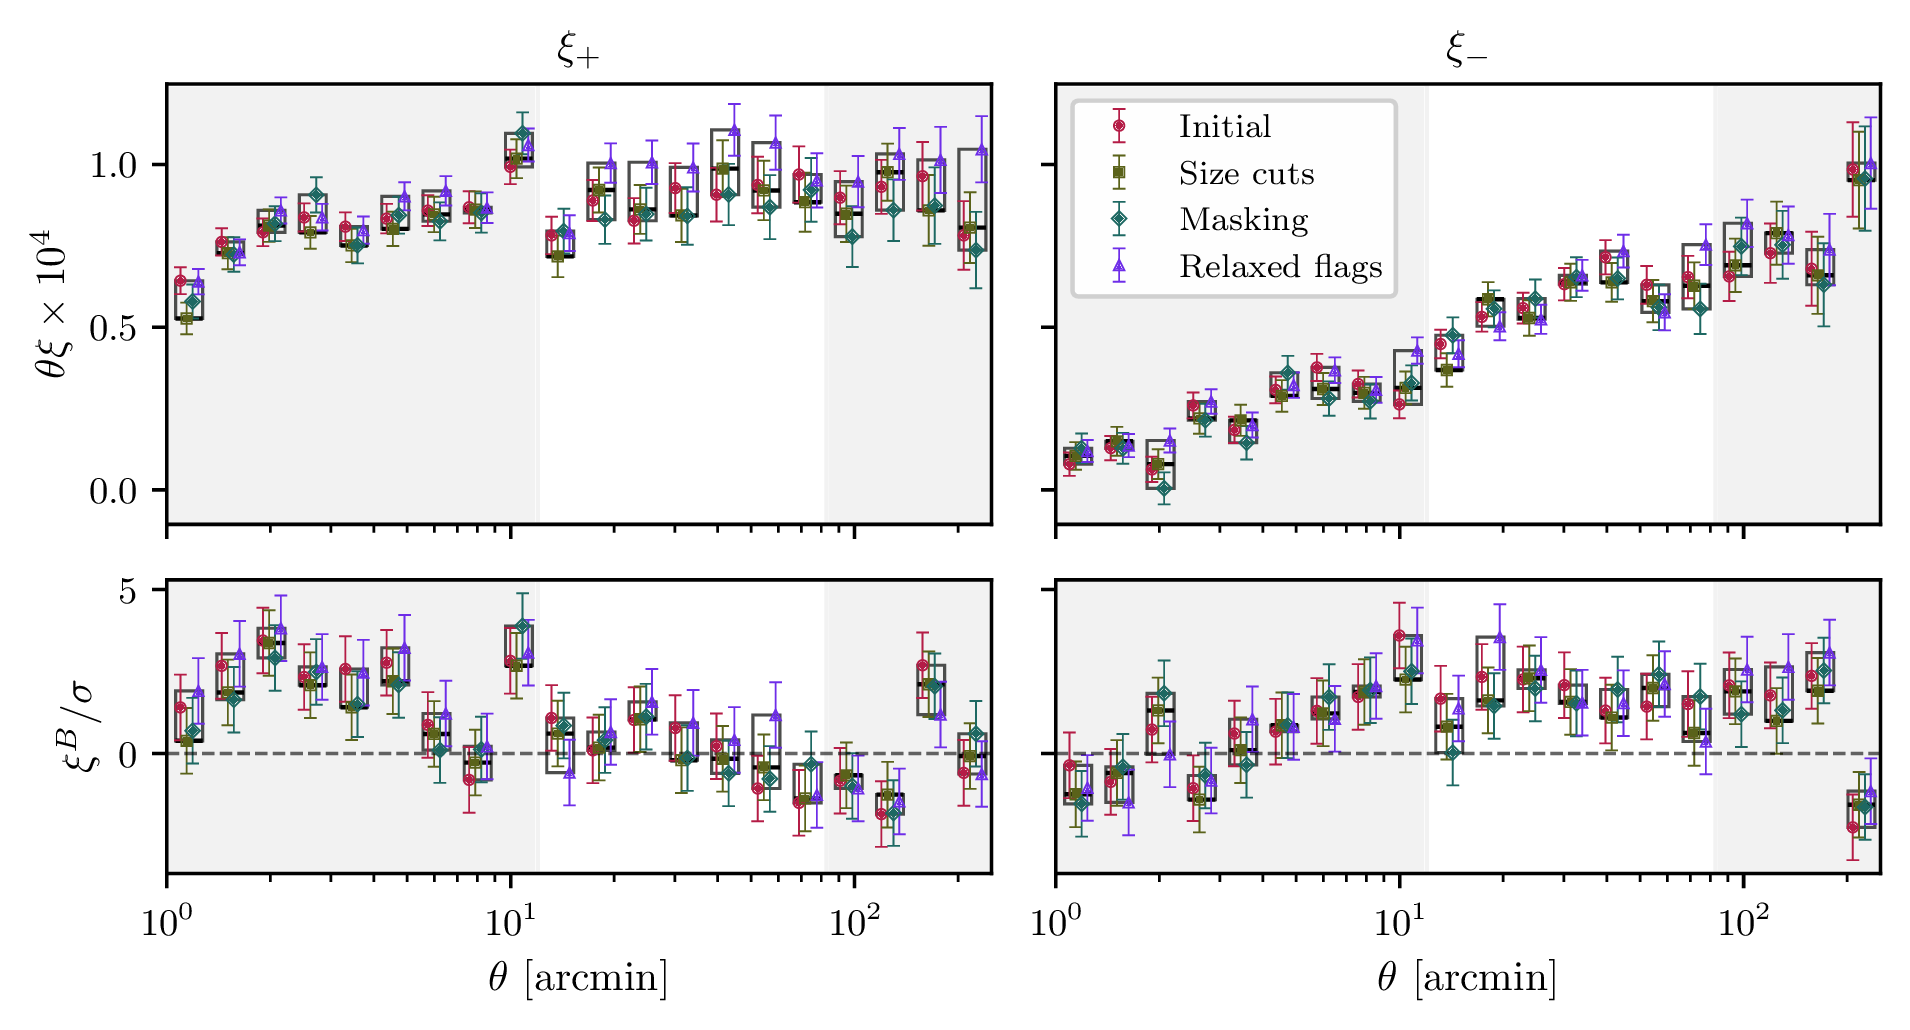
Figure 7:B-mode data vectors across catalog versions: initial (red circles), size-cut/fiducial (gold squares), masked (teal diamonds), and relaxed-flags (purple triangles). Rectangles delineate each bin in the horizontal direction and span the range of values across versions in the vertical direction; horizontal lines mark the fiducial value. Shaded bands mark fiducial scale cuts. Pure E/B-mode correlation functions: upper panels show ξ_+ and ξ_- scaled by θ; lower panels show B-mode components ξ_±^B/σ. Only the size-cut catalog passes all statistics at the fiducial scale cuts (PTE table).
Provenance
- How the fiducial θ cut is defined relative to the reporting binsBin edges of the reporting grid (indices 9, 16)
- Fiducial ShapePipe v1.4 catalog variantSize-cut (SP_v1.4.6.3_leak_corr, fiducial)
- Fiducial blind for reported data vectorsBlind A (fiducial for reported data vectors)
- Quadrature used by the pure E/B integral transformFixed-quadrature linear operator M
- Weights of the fine-to-reporting average of the pure modesPair-count weighted mean (Asgari et al. 2019 Appendix A) (adopted)
- [θ_min, θ_max] of the pure-mode integral transform[grid floor, 300'] — 0.5' data / 0.5' mocks, capped at 300'
- Construction of the pure-mode covarianceExact linear propagation M C_ξ Mᵀ, no Hartlap (adopted)
- Gaussian vs Gaussian + non-Gaussian covariancevia covarianceGaussian only (fiducial for null tests)
shapepipe_v14_catalogsshapepipe_v145_rerunfootprint_masksredshift_distributionscosmocov_binarycosmocov_libgslfootprint_mask_starhaloredshift_distributions_legacypaper_mplstyleprint_width_scriptpure_eb_version_comparison_script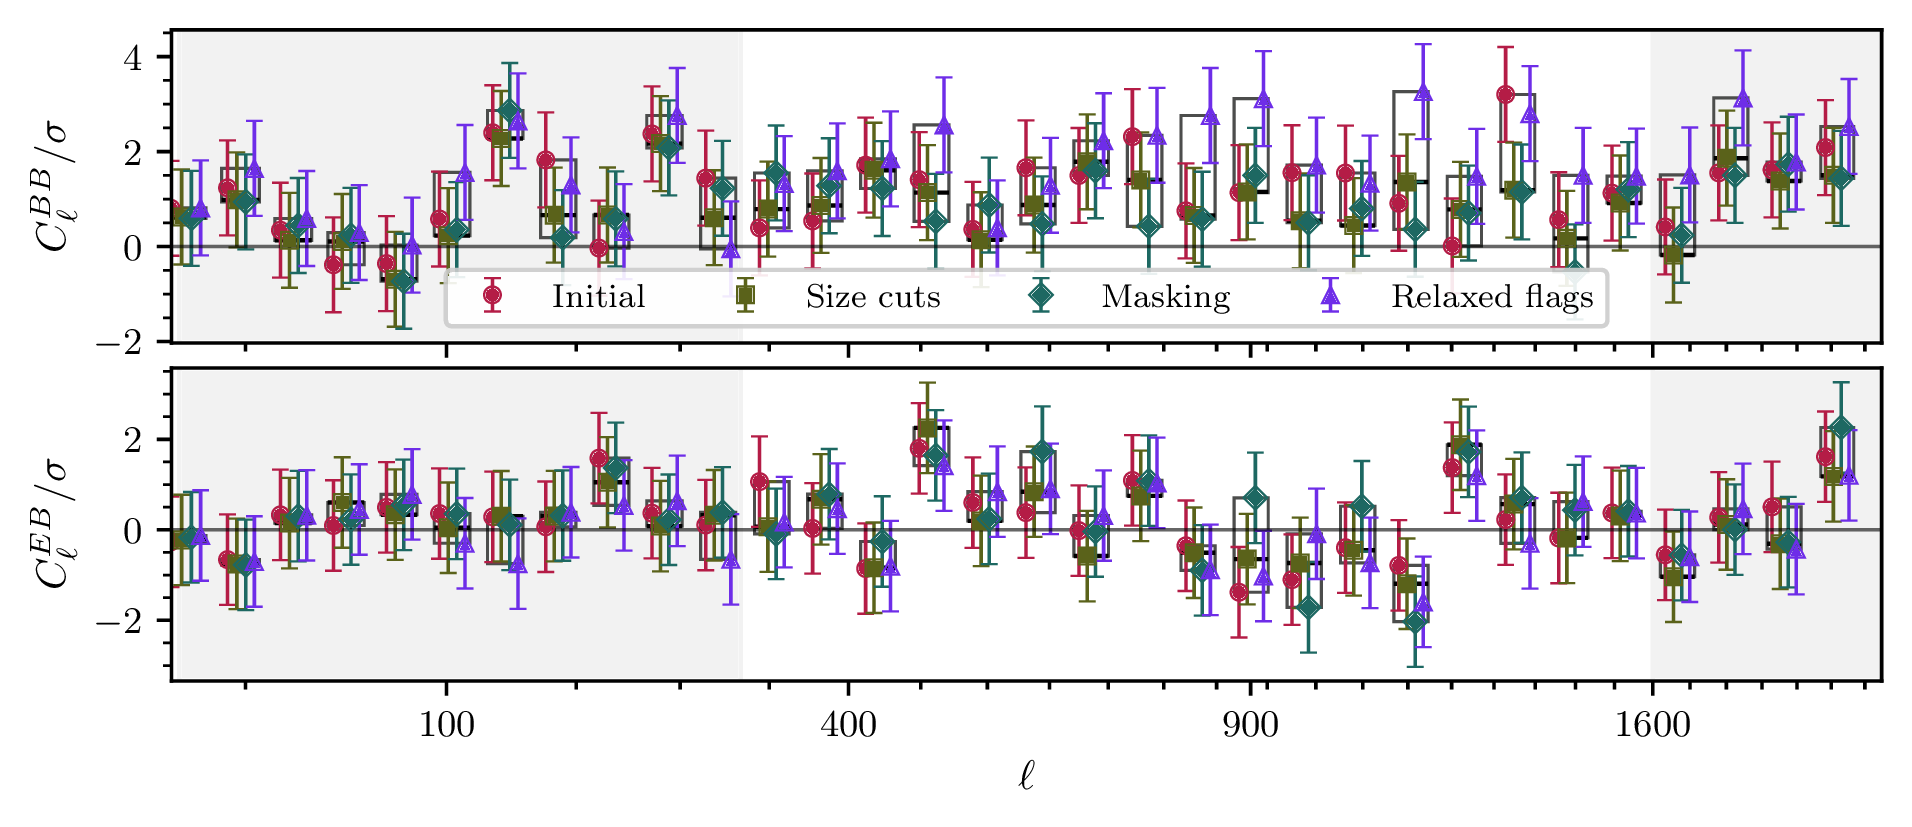
Figure 8:B-mode data vectors across catalog versions: initial (red circles), size-cut/fiducial (gold squares), masked (teal diamonds), and relaxed-flags (purple triangles). Rectangles delineate each bin in the horizontal direction and span the range of values across versions in the vertical direction; horizontal lines mark the fiducial value. Shaded bands mark fiducial scale cuts. Harmonic-space power spectra C_ℓ^BB/σ and C_ℓ^EB/σ. Only the size-cut catalog passes all statistics at the fiducial scale cuts (PTE table).
Provenance
- Fiducial ShapePipe v1.4 catalog variantSize-cut (SP_v1.4.6.3_leak_corr, fiducial)
- Fiducial blind for reported data vectorsBlind A (fiducial for reported data vectors)
redshift_distributionsfootprint_masksshapepipe_v14_catalogsshapepipe_v145_rerunredshift_distributions_legacypseudo_cl_cov_scriptpaper_mplstyleprint_width_scriptcl_version_comparison_script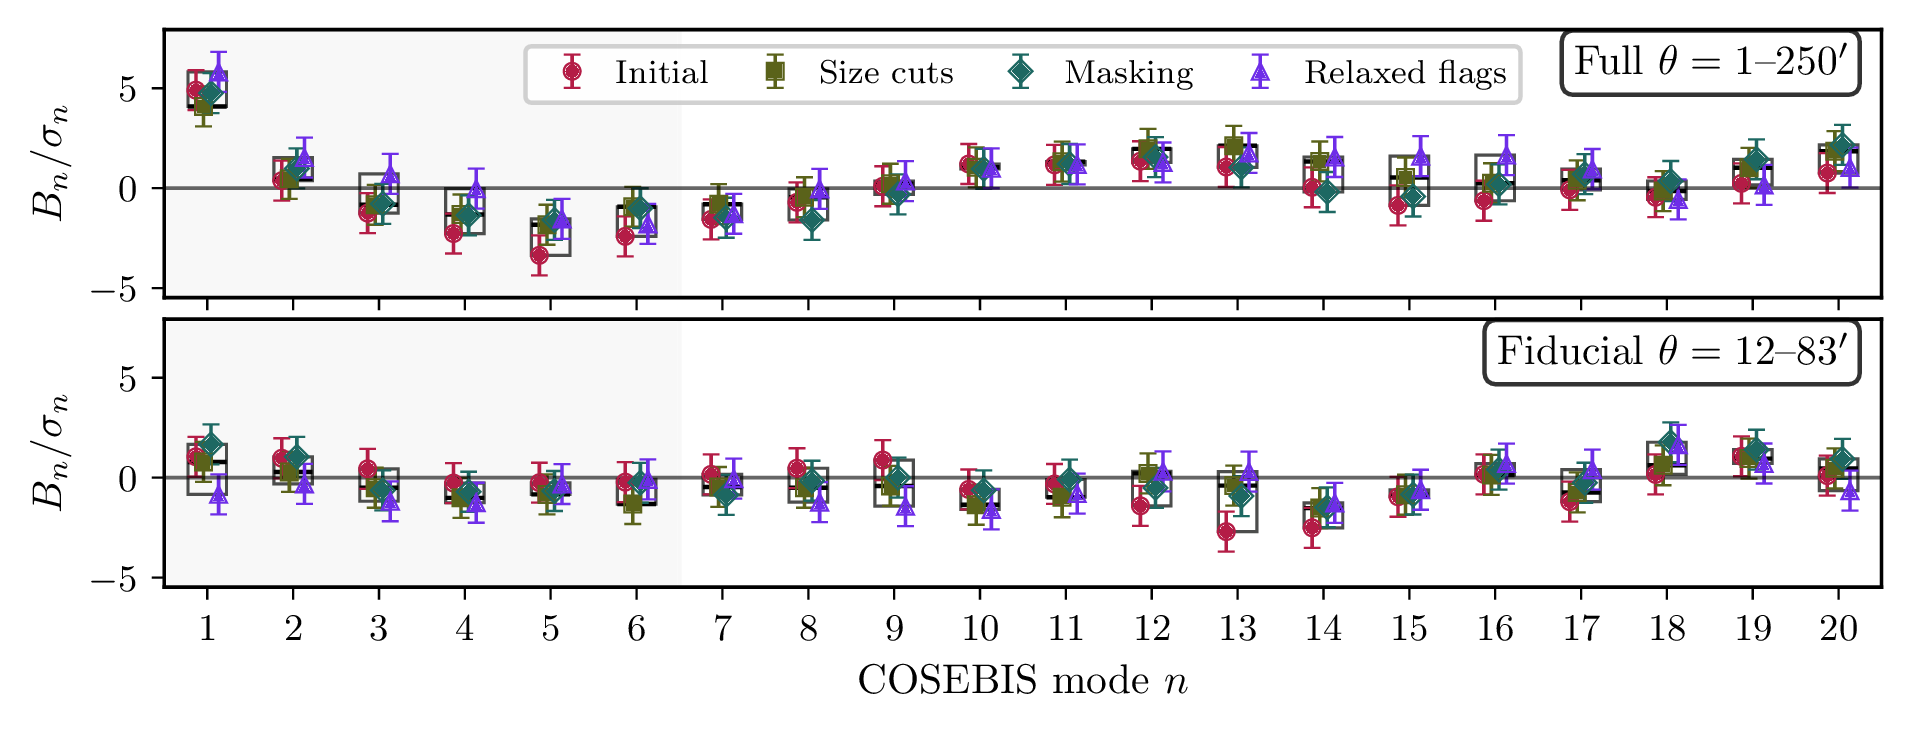
Figure 9:B-mode data vectors across catalog versions: initial (red circles), size-cut/fiducial (gold squares), masked (teal diamonds), and relaxed-flags (purple triangles). Rectangles delineate each bin in the horizontal direction and span the range of values across versions in the vertical direction; horizontal lines mark the fiducial value. COSEBI B-mode amplitudes B_n/σ_n at full range (upper) and fiducial cuts (lower). Only the size-cut catalog passes all statistics at the fiducial scale cuts (PTE table).
Provenance
- Fiducial ShapePipe v1.4 catalog variantSize-cut (SP_v1.4.6.3_leak_corr, fiducial)
- Fiducial blind for reported data vectorsBlind A (fiducial for reported data vectors)
- Number of COSEBI modes computedvia cosebis20 modes (fiducial)
- How the fiducial θ cut is defined relative to the reporting binsBin edges of the reporting grid (indices 9, 16)
- Gaussian vs Gaussian + non-Gaussian covariancevia covarianceGaussian only (fiducial for null tests)
shapepipe_v14_catalogsshapepipe_v145_rerunfootprint_masksfootprint_mask_starhaloredshift_distributionscosmocov_binarycosmocov_libgslpaper_mplstyleprint_width_scriptcosebis_version_comparison_script-mode data vectors across catalog versions: initial (red circles), size-cut/fiducial (gold squares), masked (teal diamonds), and relaxed-flags (purple triangles). Rectangles delineate each bin in the horizontal direction and span the range of values across versions in the vertical direction; horizontal lines mark the fiducial value. Shaded bands mark fiducial scale cuts for and . Top: Pure /-mode correlation functions. Upper panels show and scaled by ; lower panels show -mode components . Middle: Harmonic-space power spectra and . Bottom: COSEBI -mode amplitudes at full range (upper) and fiducial cuts (lower). Only the size-cut catalog passes all statistics at the fiducial scale cuts (table).
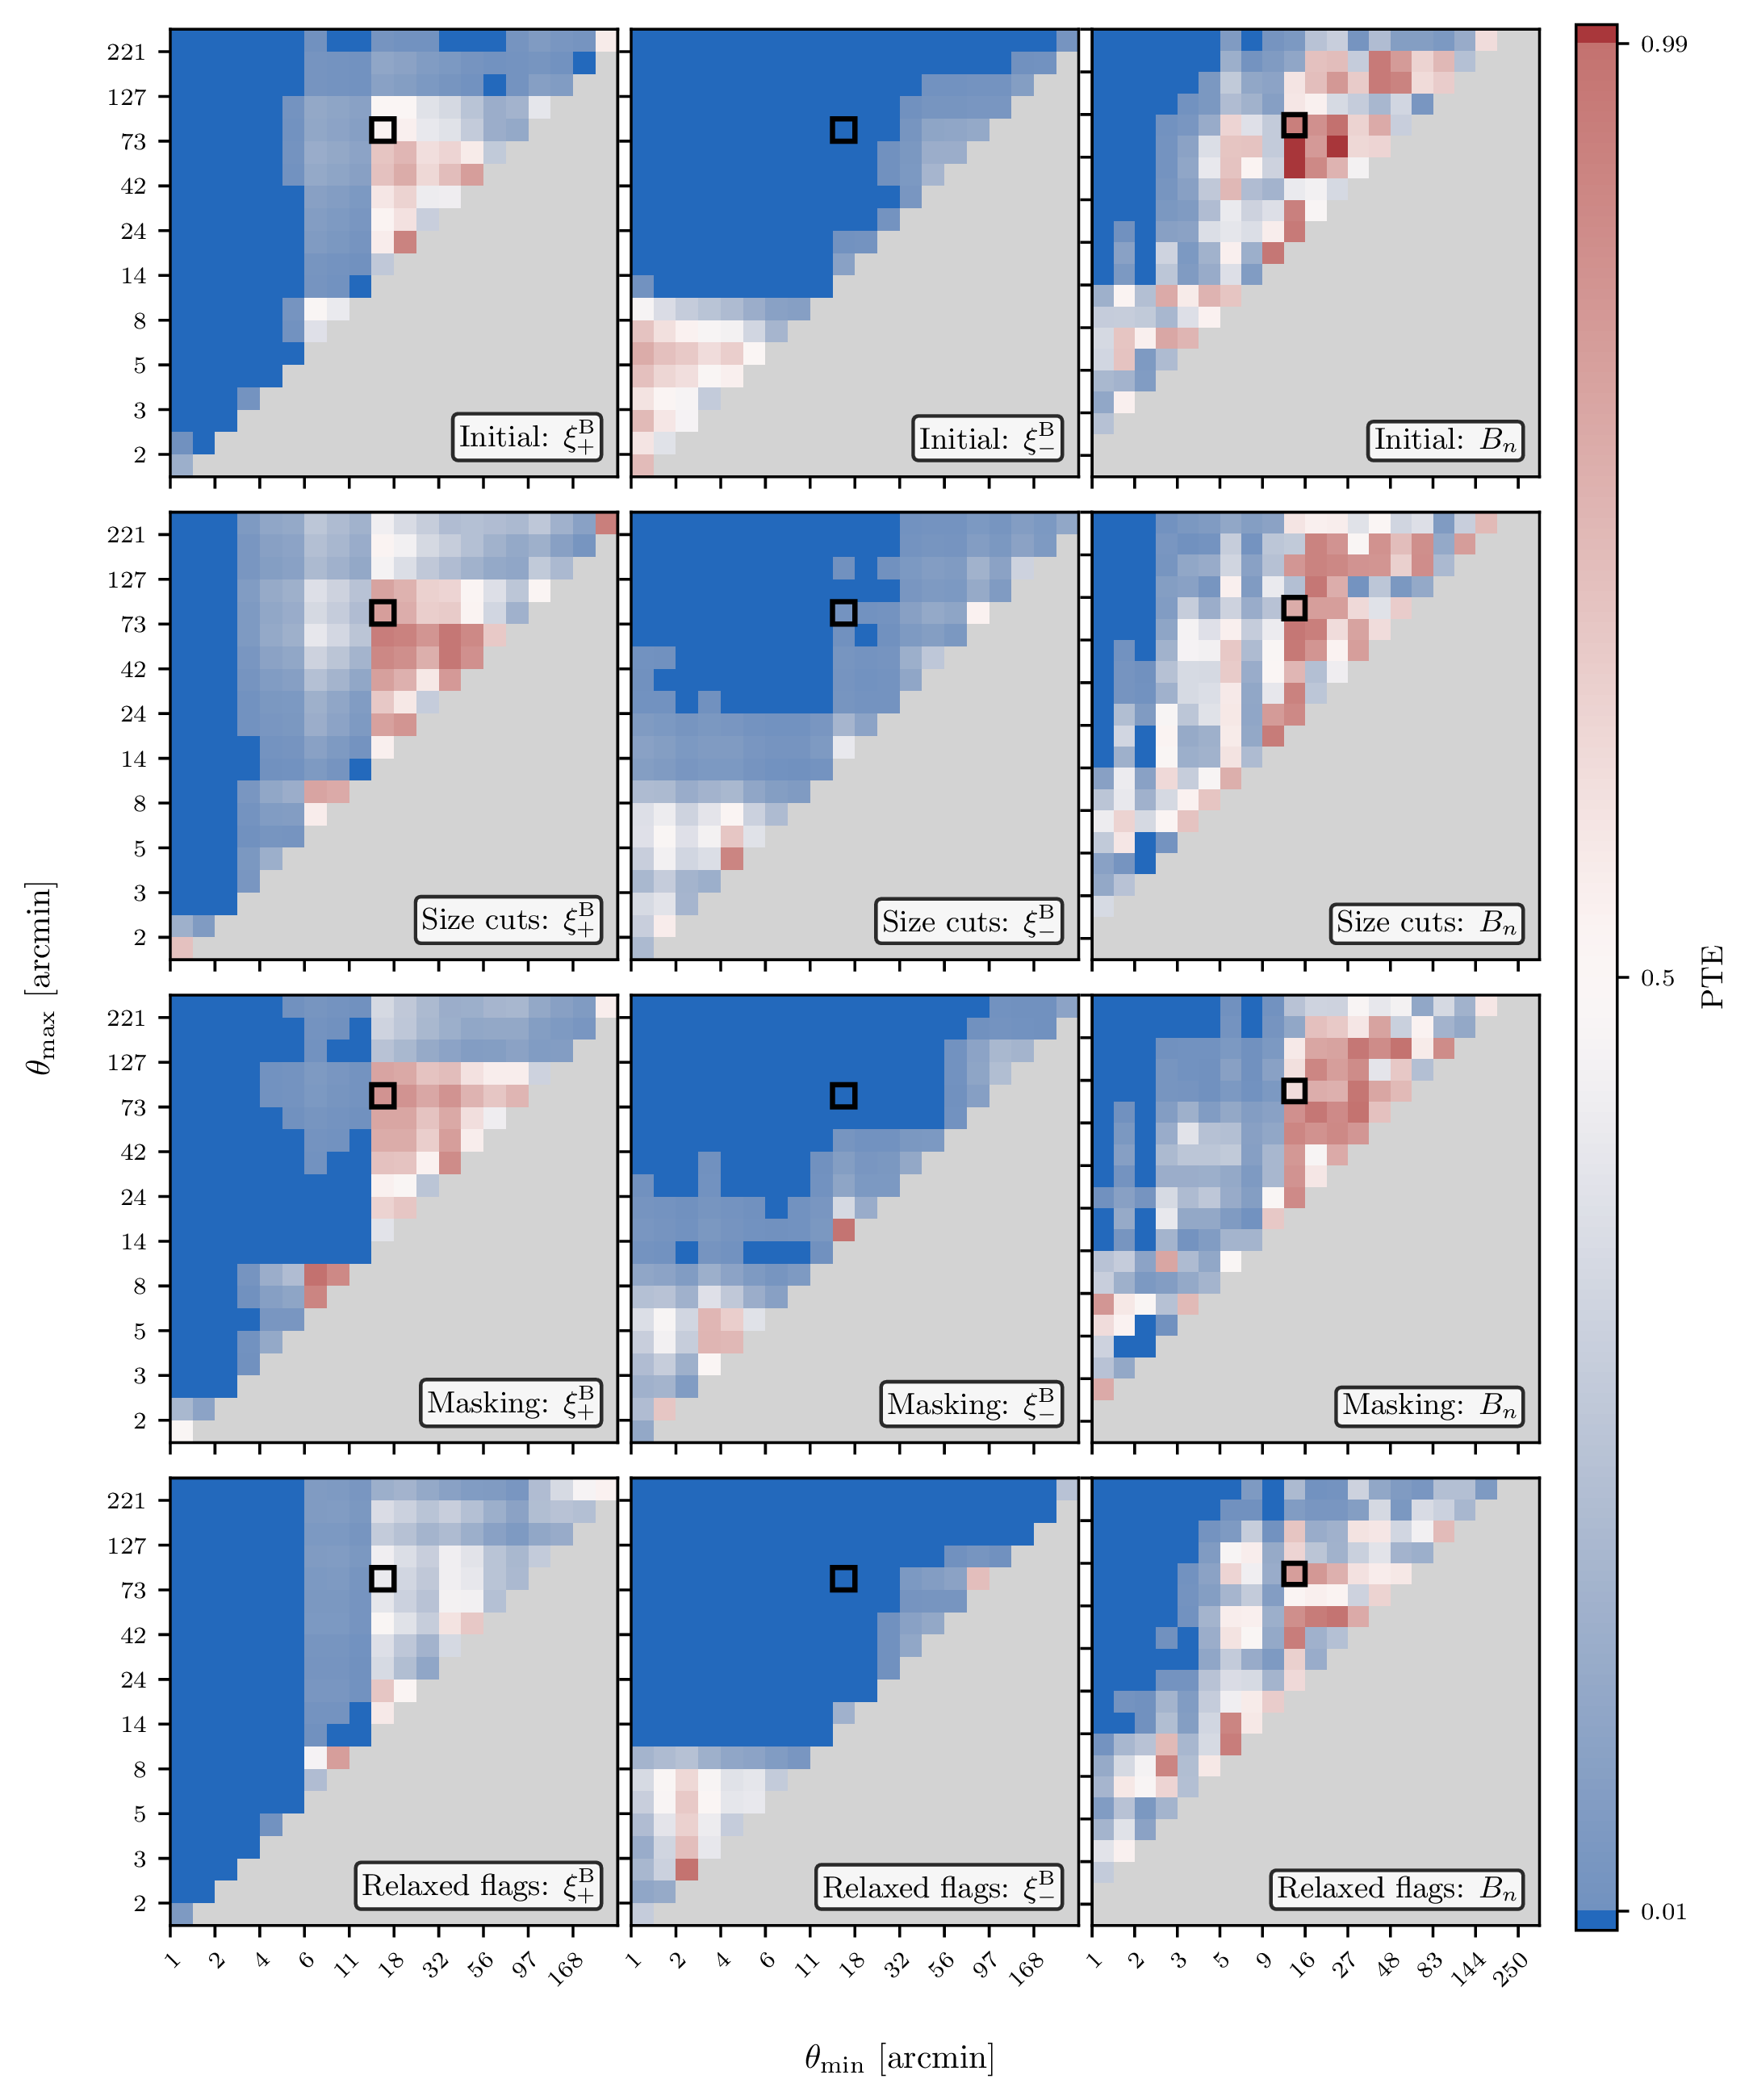
Figure 10:Configuration-space PTE maps for all four catalog versions. Columns show ξ_+^B, ξ_-^B, and COSEBI B_n (n ≤ 6) PTEs as a function of angular scale cuts; rows show different catalog versions. Solid blue cells indicate PTE < p_thr (global PTE threshold); whites and reds indicate consistency with zero. Black squares mark the adopted cuts (12–83 arcmin). The size cut (fiducial versus initial) expands the acceptance region, while stellar masking contracts it.
Provenance
- How the fiducial θ cut is defined relative to the reporting binsBin edges of the reporting grid (indices 9, 16)
- Global PTE pass/fail threshold for colour-coded heatmaps0.01 (adopted representative value; 350-mock calibration)
- Fiducial ShapePipe v1.4 catalog variantSize-cut (SP_v1.4.6.3_leak_corr, fiducial)
- Fiducial blind for reported data vectorsBlind A (fiducial for reported data vectors)
- Quadrature used by the pure E/B integral transformFixed-quadrature linear operator M
- Weights of the fine-to-reporting average of the pure modesPair-count weighted mean (Asgari et al. 2019 Appendix A) (adopted)
- [θ_min, θ_max] of the pure-mode integral transform[grid floor, 300'] — 0.5' data / 0.5' mocks, capped at 300'
- Construction of the pure-mode covarianceExact linear propagation M C_ξ Mᵀ, no Hartlap (adopted)
- Gaussian vs Gaussian + non-Gaussian covariancevia covarianceGaussian only (fiducial for null tests)
- Scale-cut pair grid for COSEBI PTE matricesvia cosebisStable index pairs of geomspace(1', 250', 21) (fiducial)
- PTE-reported mode subsetsvia cosebisBoth subsets (fiducial)
shapepipe_v14_catalogsshapepipe_v145_rerunfootprint_masksfootprint_mask_starhaloredshift_distributionscosmocov_binarycosmocov_libgslredshift_distributions_legacyconfig_space_pte_matrices_scriptscale_cuts_scriptprint_width_scriptpaper_mplstyleConfiguration-space PTE maps for all four catalog versions (table). Columns show , , and COSEBI () PTEs as a function of angular scale cuts; rows show different catalog versions. Solid blue cells indicate PTE 0.01; whites and reds indicate consistency with zero. Black squares mark the adopted cuts (12--83 arcmin). The size cut (fiducial versus initial) expands the acceptance region, while stellar masking contracts it.
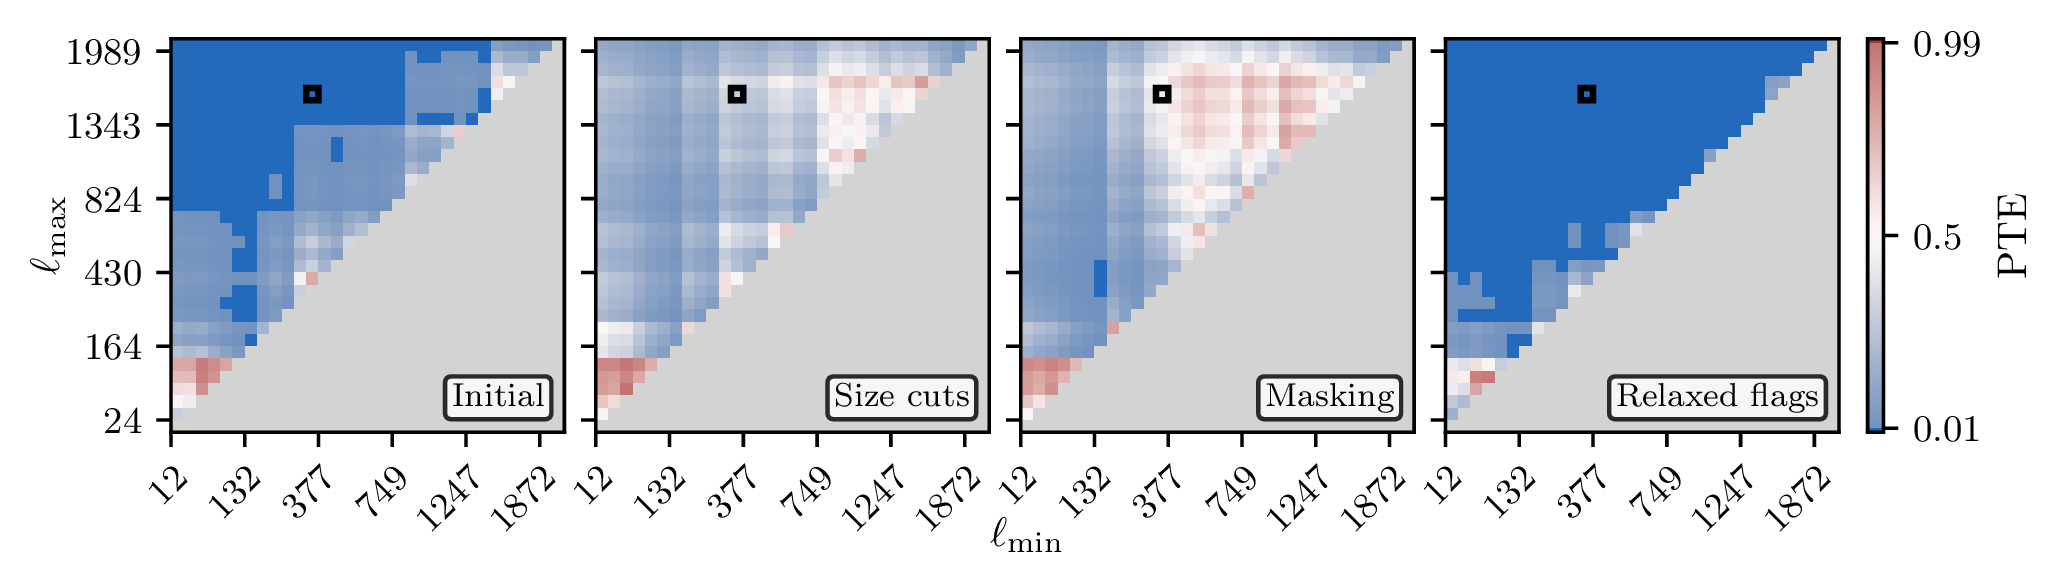
Figure 11:Harmonic-space C_ℓ^BB PTE maps for all four catalog versions. Solid blue cells indicate failing PTEs (global PTE threshold); whites and reds indicate consistency with zero. The initial and relaxed-flags catalogs show widespread failures across multipole ranges; the fiducial and masked catalogs pass across nearly all multipole combinations.
Provenance
- Global PTE pass/fail threshold for colour-coded heatmaps0.01 (adopted representative value; 350-mock calibration)
- Fiducial ShapePipe v1.4 catalog variantSize-cut (SP_v1.4.6.3_leak_corr, fiducial)
- Fiducial blind for reported data vectorsBlind A (fiducial for reported data vectors)
redshift_distributionsfootprint_masksshapepipe_v14_catalogsshapepipe_v145_rerunredshift_distributions_legacypseudo_cl_cov_scriptharmonic_space_pte_matrices_scriptprint_width_scriptpaper_mplstyleHarmonic-space PTE maps for all four catalog versions (table). Solid blue cells indicate failing PTEs; whites and reds indicate consistency with zero. The initial and relaxed-flags catalogs show widespread failures across multipole ranges; the fiducial and masked catalogs pass across nearly all multipole combinations.
Discussion
The pure-mode correlation functions, COSEBIs, and harmonic-space power spectra presented in this paper weight angular scales and treat ambiguous modes differently, so they do not respond identically to the same contamination. When they disagree, we treat that as evidence of contamination in the sample even if each statistic is not equally sensitive to it, and require the adopted catalog and cuts to pass in all three frameworks.
At full range, all four catalogs show a COSEBI first-mode excess exceeding and oscillatory structure across all twenty modes. Because COSEBIs are orthogonal over a finite angular range (section), a feature compact in angle spreads across the mode spectrum; the full-range oscillations are qualitatively consistent with contamination at CCD angular scales (section, figure). In the pure-mode data vectors, shows a outlier in the 9--12 arcmin bin, at CCD scales, where the total also show noticeable breaks (figure). In harmonic space, has a few outliers at low and elevated power in the highest multipole bins, without a sharp angular signature that would point unambiguously to CCD-scale contamination. MegaCam’s 40 CCDs (figure) span 6--14 arcmin individually, and our adopted lower cut of 12 arcmin excludes most pair separations at these scales; at the adopted scale cuts, the COSEBI features are suppressed and the COSEBI tests pass for all four catalogs. Pure-mode correlation functions and on the other hand pass at the adopted cuts only for the size-cut catalog and for the size-cut and masked versions, respectively. These equivocal results lead us to argue against relying on any single null test; taken together, we choose the size-cut catalog and our adopted scale cuts as the combination least affected by systematic contamination for cosmological inference in Papers III and IV.
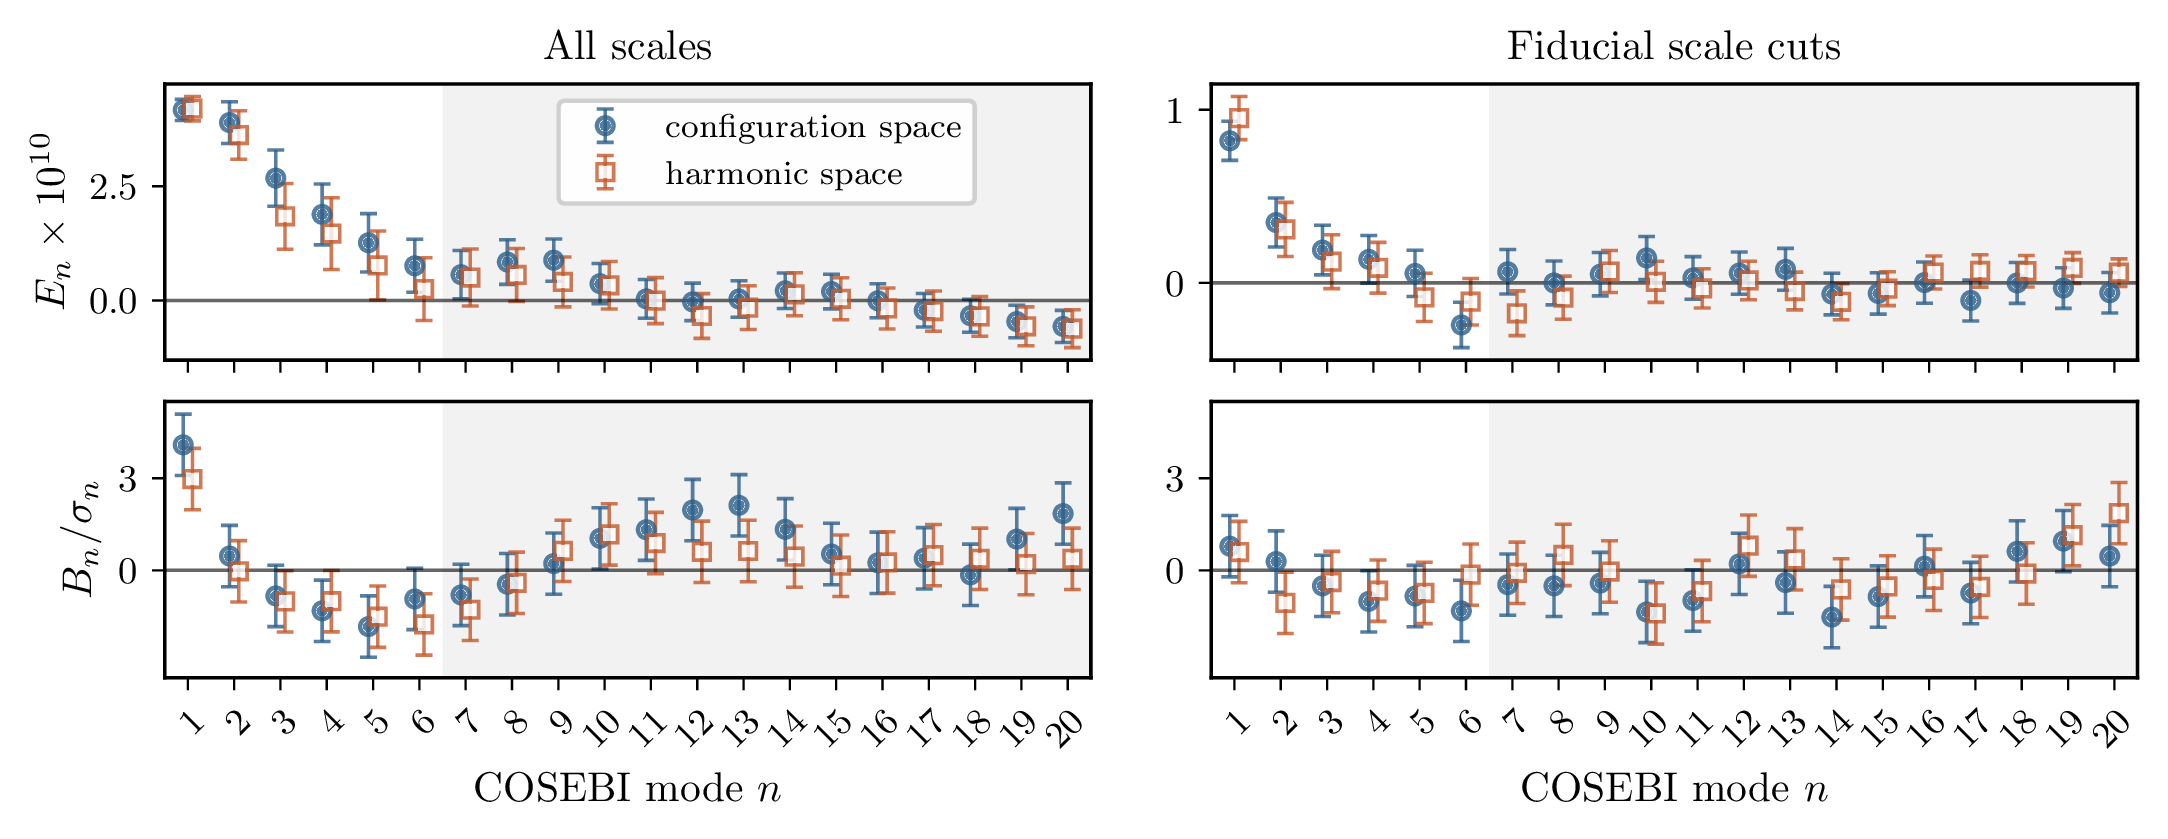
Figure 12:COSEBI E_n (top row) and B_n/σ_n (bottom row) for the fiducial catalog, computed from configuration-space ξ_± (filled circles) and harmonic-space bandpowers (open squares). Modes n > 6 are shaded; for n ≤ 6, where the cosmological information is concentrated, we confirm consistency between the two paths on GLASS simulations.
Provenance
- Fiducial ShapePipe v1.4 catalog variantSize-cut (SP_v1.4.6.3_leak_corr, fiducial)
- How the fiducial θ cut is defined relative to the reporting binsBin edges of the reporting grid (indices 9, 16)
- Fiducial blind for reported data vectorsBlind A (fiducial for reported data vectors)
- Pseudo-Cℓ bandpower count for the harmonic COSEBI pathvia cosebis96 √ℓ-linear bandpowers (fiducial)
shapepipe_v14_catalogsshapepipe_v145_rerunredshift_distributionsfootprint_maskspseudo_cl_cov_scriptcosmocov_binarycosmocov_libgslharmonic_config_cosebis_comparison_figure_scriptCOSEBI (top row) and (bottom row) for the fiducial catalog, computed from configuration-space (filled circles) and harmonic-space bandpowers (open squares). Modes are shaded; for , where the cosmological information is concentrated, we confirm consistency between the two paths on GLASS simulations.
Although the masked catalog passes in , , harmonic space, and COSEBIs (), this ostensibly more conservative choice fails in . Excising stellar halos introduces irregular gaps in the survey footprint (figure), and because -modes are non-local, a more complex mask geometry may increase the fraction of modes classified as ambiguous, leaving the remaining pure-mode estimates less stable; alternatively, removing regions of elevated shape noise near bright stars could increase the significance of contamination elsewhere. We cannot distinguish these explanations with the present data. Our footprints are reconstructed by binning the catalog’s per-object mask flags onto a HEALPix grid (Paper I) rather than taken directly from the underlying pixelized masks; the UNIONS tomographic analysis now in progress defines the footprint from the pixelized masks themselves, which will allow a better understanding of the impact of the masks on the data. The initial and relaxed-flags catalogs fail in and harmonic space, consistent with poorly resolved or deblended objects contributing to the contamination; the relaxed-flags catalog also shifts the total systematically higher than the other versions beyond 16 arcmin (figure), suggesting that admitting these objects affects the signal itself, not only the -mode diagnostics.
Configuration-space and harmonic-space estimators respond differently to the same contamination. Pure-mode correlation functions are localized in angular separation, so cuts that remove CCD-scale separations directly reduce the contamination. In multipole space, a feature narrow in angle maps onto a broad range of , so it cannot be isolated by cutting a localized multipole range. COSEBIs apply filter functions to the two-point statistics that concentrate cosmological information into the first few modes; contamination at a characteristic angular scale spreads across the mode spectrum rather than isolating in a single mode. Pure-mode and COSEBI filters also discard ambiguous modes (section) that cannot be uniquely classified as or on a finite angular interval. The harmonic-space estimator used here does not deproject ambiguous modes; it assigns all power to or , and any residual mask-induced -to- leakage after mode-coupling deconvolution is absorbed into .
We show directly that and COSEBIs have different sensitivity to systematic features, even when computed from the same data, by transforming the harmonic-space bandpowers into COSEBIs (equation). The power spectrum passes the null test at our fiducial multipole range, yet COSEBIs computed from the same harmonic-space data fail at full angular range---because the COSEBI filter functions weight the power spectrum differently, concentrating sensitivity on the scales where the contamination resides. This provides empirical support for the argument of Asgari et al. (2019) that a null test in one representation cannot validate another; Jefferson et al. (2025) reached the same conclusion across DES-Y3, KiDS-1000, and HSC-Y3, finding that tomographic bins passing pseudo- -mode tests can fail when reanalyzed with HybridEB. The converse also holds: a -mode failure in any statistic should raise concern for cosmological inference in all of them, since the underlying contamination is present in the data regardless of how it is projected.
figure compares COSEBIs computed from configuration-space and from harmonic-space bandpowers. Both and agree across the two computation paths for all twenty modes, with the tightest correspondence in the first six modes validated on GLASS simulations. At fiducial scale cuts, both paths yield -modes consistent with zero (PTE 0.6 harmonic, 0.78 configuration; ). At full range, both detect the same structure (PTE 1.62 × 10⁻⁵ and 1.37 × 10⁻⁵). This confirms that the sensitivity to systematic contamination is set by the filter functions, not by the basis in which the two-point function is measured. Throughout this analysis, we use Gaussian-only covariance, which underestimates variances for the UNIONS geometry (section); the reported PTEs are therefore conservative.
Asgari et al. (2019) identified an oscillatory COSEBI -mode pattern in multiple Stage-III surveys---CFHTLenS, KiDS-450, and DES-SV---tracing it to a repeating additive shear bias (i.e. a spatially varying -term) from detector-level effects fixed in focal-plane coordinates. Its appearance across three Stage-III surveys points to a detector-level phenomenon rather than a pipeline-specific artifact, a point especially relevant for UNIONS because CFHTLenS also used MegaCam on CFHT Heymans et al., 2012Guinot et al., 2022. The dither strategy, however, differs substantially. CFHTLenS and KiDS used small dithers designed to bridge chip gaps, so the focal-plane pattern maps almost directly onto the sky. UNIONS dithers by of the MegaCam field of view Gwyn et al., 2025, larger than a single CCD, so each sky position averages the additive bias from several different CCDs across exposures. Asgari et al. (2019) note that the -mode signature of a repeating additive pattern depends on the dithering strategy, pointing to DES-SV’s half-field dithers as one reason its pattern differs from the small-dither surveys. The larger UNIONS dithers may similarly attenuate the amplitude of the repeating pattern, but are unlikely to fully eliminate it: the effective pattern is the per-CCD bias convolved with the dither geometry, potentially spreading the characteristic angular scale beyond the 6--14 arcmin CCD footprint.
A repeating additive shear bias could itself be created by PSF leakage that is tied to an instrumental or observational scale. The -statistics and diagnostics of Paper I show a feature near the arcmin size of a MegaCam CCD, consistent with CCD-scale leakage. In the simulations of Asgari et al. (2019), spatially varying PSF leakage mainly raises the low COSEBI modes, while a repeating additive bias produces oscillations across modes; our full-range first-mode excess and oscillations resemble these signatures respectively. However, leakage correction does not significantly change either feature (section), pointing to either a different origin for the -modes or leakage beyond our second-order model from higher-order PSF moments Zhang et al., 2023.
Paper V discusses a possible pipeline-specific source arising from the improper propagation of exposure offsets within the shape measurement pipeline. In the current multi-exposure fitting procedure, objects are effectively assumed to be centered on the pixel grid of each individual exposure. However, a consistent treatment would require recentering the model using the World Coordinate System (WCS), anchored to the detection position defined at the tile level. In areas where CCDs overlap, the relative pixel offsets between exposures can induce a preferred orientation in the inferred galaxy shapes, corresponding to the vector displacements between exposure pixel grids. As a result, a coherent additive shear pattern may be imprinted across the CCD overlap regions, on angular scales between the per-CCD footprint (--14 arcmin) and the UNIONS dither spacing ( MegaCam FoV, or arcmin). The observed -mode contamination concentrates at 12 arcmin (figure), close to the per-CCD scale but below the dither offsets. Whether this mechanism is responsible for the observed modes remains an open question. Even so, a contamination localized near the CCD scale would be cut away in configuration space, while its Hankel transform to harmonic space would spread across multipoles, beyond any single cut. If a comparable additive contribution were present in the modes, it would lift the harmonic-space relative to configuration space, and could contribute to the mild offset seen between Papers III and IV. Including configuration-space scales down to 5 arcmin does move its toward the harmonic value (Paper III). While a fraction of these effects may be absorbed by standard multiplicative bias corrections, we mitigate any remaining impact on cosmological constraints by cutting the majority of CCD scales.
An alternative to excluding contaminated scales would be to model the -mode signal as a bias and subtract it from the total measurement. However, the relationship between - and -mode contamination depends on the physical mechanism; Asgari et al. (2019) showed that different systematics produce markedly different / ratios, so the -mode amplitude alone does not determine the -mode contamination. We therefore treat -modes as a diagnostic rather than a correction: scale cuts that remove -mode contamination also remove any corresponding contamination of the total signal, without assuming a model for the relationship between them.
Conclusions
UNIONS-3500 weak-lensing modes are consistent with zero at the adopted scale cuts across pure-mode correlation functions, COSEBIs, and harmonic-space power spectra. Without scale cuts, and the COSEBIs show significant modes on small scales, whereas and show a broad, low-level excess with little scale dependence; this excess is significant in on large scales and marginal at the fiducial cuts.
On the full angular range, all catalog versions show an oscillatory COSEBI -mode pattern plausibly caused by a repeating additive shear bias at CCD angular scales Asgari et al., 2019. This is especially relevant for UNIONS because a similar signature also appeared in CFHTLenS, which likewise used MegaCam on CFHT Heymans et al., 2012Guinot et al., 2022. Our adopted lower cut suppresses this pattern without discarding the angular scales that carry most of the cosmological signal. By computing COSEBIs from the harmonic-space bandpowers, we confirm that the disagreement is not a matter of harmonic versus real space: passes where COSEBIs fail, because the COSEBI filter functions concentrate sensitivity on the contaminated scales.
Of the four catalog variants tested, only the fiducial passes in every representation. Each statistic responds differently: tightening the galaxy-size cut suppresses -mode power in and harmonic space; adding stellar-halo masks causes a failure in ; and COSEBIs () pass for all versions, even though the full-range measurements show strong low-order structure. These differences arise because the same contamination projects differently into angular, modal, and multipole representations; demanding that all three frameworks pass simultaneously places tighter constraints than any single null test. Papers III and IV adopt these fiducial cuts for cosmological inference.
Because the underlying contamination is present in the data regardless of how it is projected, a -mode failure in any one framework warrants scrutiny across all of them. Rather than modeling -modes as a bias to subtract, we use them as a diagnostic: scale cuts that remove -mode contamination also remove any corresponding contamination of the cosmological signal, without assuming a model for the / ratio. Whether the same CCD-scale effects arise in Euclid and the Legacy Survey of Space and Time (LSST), with their different detector geometries and dithering strategies, remains to be seen. As surveys become systematics-limited, disagreements between -mode estimators will carry as much information as their agreements; multi-framework validation will be needed to distinguish instrumental contamination, pipeline effects, and residual astrophysical signals.
(data-availability .unnumbered)=
Acknowledgments
We are honored and grateful for the opportunity of observing the Universe from Maunakea and Haleakala, which both have cultural, historical and natural significance in Hawaii. This work is based on data obtained as part of the Canada-France Imaging Survey, a CFHT large program of the National Research Council of Canada and the French Centre National de la Recherche Scientifique. Based on observations obtained with MegaPrime/MegaCam, a joint project of CFHT and CEA Saclay, at the Canada-France-Hawaii Telescope (CFHT) which is operated by the National Research Council (NRC) of Canada, the Institut National des Sciences de l’Univers (INSU) of the Centre National de la Recherche Scientifique (CNRS) of France, and the University of Hawaii. This research used the facilities of the Canadian Astronomy Data Centre operated by the National Research Council of Canada with the support of the Canadian Space Agency. This research is based in part on data collected at Subaru Telescope, which is operated by the National Astronomical Observatory of Japan. Pan-STARRS is a project of the Institute for Astronomy of the University of Hawaii, and is supported by the NASA SSO Near Earth Observation Program under grants 80NSSC18K0971, NNX14AM74G, NNX12AR65G, NNX13AQ47G, NNX08AR22G, 80NSSC21K1572 and by the State of Hawaii. CD and MK acknowledge support from the Agence Nationale de la Recherche (ANR-22-CE31-0014-01) TOSCA project. This work was made possible by utilizing the CANDIDE cluster at the Institut d’Astrophysique de Paris. The cluster was funded through grants from the PNCG, CNES, DIM-ACAV, the Euclid Consortium, and the Danish National Research Foundation Cosmic Dawn Center (DNRF140); it is maintained by Stephane Rouberol. The authors acknowledge the use of the Canadian Advanced Network for Astronomy Research (CANFAR) Science Platform operated by the Canadian Astronomy Data Centre (CADC) and the Digital Research Alliance of Canada (DRAC), with support from the National Research Council of Canada (NRC), the Canadian Space Agency (CSA), CANARIE, and the Canada Foundation for Innovation (CFI). LWKG thanks the University of Edinburgh School of Physics and Astronomy for a postdoctoral Fellowship. AG acknowledges the support of a grant from the Simons Foundation (Simons Investigator in Astrophysics, Award ID 620789). HH is supported by a DFG Heisenberg grant (Hi 1495/5-1), the DFG Collaborative Research Center SFB1491, an ERC Consolidator Grant (No. 770935), and the DLR project 50QE2305. MJH acknowledges support from NSERC through a Discovery Grant. LVW acknowledges support from NSERC through a Discovery Grant. We would like to thank our external blinding coordinator, Koen Kuijken. We thank Douglas Scott for a thorough reading and detailed scientific and editorial comments. This work made use of large language models (Claude, Anthropic; Codex, OpenAI) for code development, data analysis, and manuscript preparation. All AI-assisted output was reviewed and validated by the lead author.
Data Availability
A subset of the raw data underlying this article is publicly available via the Canadian Astronomical Data Centre at http://
(acknowledgements .unnumbered)=
The most pessimistic alternative treats the two scale-cut boundaries as fitted parameters and reduces by two for every statistic. The minimum PTE at the fiducial cuts, from , then falls from 0.019 to 0.005, just below the threshold of 0.006 calibrated at these cuts.
- Blandford, R. D., Saust, A. B., Brainerd, T. G., & Villumsen, J. V. (1991). The distortion of distant galaxy images by large-scale structure. \mnras, 251, 600. 10.1093/mnras/251.4.600
- Miralda-Escude, J. (1991). The Correlation Function of Galaxy Ellipticities Produced by Gravitational Lensing. \apj, 380, 1. 10.1086/170555
- Kaiser, N. (1992). Weak Gravitational Lensing of Distant Galaxies. \apj, 388, 272. 10.1086/171151
- Bacon, D. J., Refregier, A. R., & Ellis, R. S. (2000). Detection of weak gravitational lensing by large-scale structure. \mnras, 318(2), 625–640. 10.1046/j.1365-8711.2000.03851.x
- Kaiser, N., Wilson, G., & Luppino, G. A. (2000). Large-Scale Cosmic Shear Measurements. arXiv E-Prints, astro-ph/0003338. 10.48550/arXiv.astro-ph/0003338
- Van Waerbeke, L., Mellier, Y., Erben, T., Cuillandre, J. C., Bernardeau, F., Maoli, R., Bertin, E., McCracken, H. J., Le Fèvre, O., Fort, B., Dantel-Fort, M., Jain, B., & Schneider, P. (2000). Detection of correlated galaxy ellipticities from CFHT data: first evidence for gravitational lensing by large-scale structures. \aap, 358, 30–44. 10.48550/arXiv.astro-ph/0002500
- Wittman, D. M., Tyson, J. A., Kirkman, D., Dell’Antonio, I., & Bernstein, G. (2000). Detection of weak gravitational lensing distortions of distant galaxies by cosmic dark matter at large scales. \nat, 405(6783), 143–148. 10.1038/35012001
- Stebbins, A. (1996). Weak Lensing On the Celestial Sphere. 10.48550/arXiv.astro-ph/9609149
- Kamionkowski, M., Kosowsky, A., & Stebbins, A. (1997). Statistics of cosmic microwave background polarization. \prd, 55(12), 7368–7388. 10.1103/PhysRevD.55.7368
- Hilbert, S., Hartlap, J., White, S. D. M., & Schneider, P. (2009). Ray-tracing through the Millennium Simulation: Born corrections and lens-lens coupling in cosmic shear and galaxy-galaxy lensing. \aap, 499(1), 31–43. 10.1051/0004-6361/200811054
- Schneider, P., van Waerbeke, L., & Mellier, Y. (2002). B-modes in cosmic shear from source redshift clustering. \aap, 389, 729–741. 10.1051/0004-6361:20020626
- Crittenden, R. G., Natarajan, P., Pen, U.-L., & Theuns, T. (2002). Discriminating Weak Lensing from Intrinsic Spin Correlations Using the Curl-Gradient Decomposition. \apj, 568(1), 20–27. 10.1086/338838
- Cooray, A., & Hu, W. (2002). Second-Order Corrections to Weak Lensing by Large-Scale Structure. \apj, 574(1), 19–23. 10.1086/340892
- Robertson, M., Fabbian, G., Carron, J., & Lewis, A. (2025). Detectable signals of post-Born lensing curl B-modes. \jcap, 2025(2), 034. 10.1088/1475-7516/2025/02/034
- Asgari, M., Lin, C.-A., Joachimi, B., Giblin, B., Heymans, C., Hildebrandt, H., Kannawadi, A., Stölzner, B., Tröster, T., van den Busch, J. L., Wright, A. H., Bilicki, M., Blake, C., de Jong, J., Dvornik, A., Erben, T., Getman, F., Hoekstra, H., Köhlinger, F., … Valentijn, E. (2021). KiDS-1000 cosmology: Cosmic shear constraints and comparison between two point statistics. \aap, 645, A104. 10.1051/0004-6361/202039070